Trade
Basic
Futures
Futures
Hundreds of contracts settled in USDT or BTC
TradFi
Gold
Trade global traditional assets with USDT in one place
Options
Hot
Trade European-style vanilla options
Unified Account
Maximize your capital efficiency
Demo Trading
Futures Kickoff
Get prepared for your futures trading
Futures Events
Participate in events to win generous rewards
Demo Trading
Use virtual funds to experience risk-free trading
Earn
Launch
CandyDrop
Collect candies to earn airdrops
Launchpool
Quick staking, earn potential new tokens
HODLer Airdrop
Hold GT and get massive airdrops for free
Launchpad
Be early to the next big token project
Alpha Points
Trade on-chain assets and enjoy airdrop rewards!
Futures Points
Earn futures points and claim airdrop rewards
Investment
Simple Earn
Earn interests with idle tokens
Auto-Invest
Auto-invest on a regular basis
Dual Investment
Buy low and sell high to take profits from price fluctuations
Soft Staking
Earn rewards with flexible staking
Crypto Loan
0 Fees
Pledge one crypto to borrow another
Lending Center
One-stop lending hub
VIP Wealth Hub
Customized wealth management empowers your assets growth
Private Wealth Management
Customized asset management to grow your digital assets
Quant Fund
Top asset management team helps you profit without hassle
Staking
Stake cryptos to earn in PoS products
Smart Leverage
New
No forced liquidation before maturity, worry-free leveraged gains
GUSD Minting
Use USDT/USDC to mint GUSD for treasury-level yields
More
BullishBlockchain
No content yet
BullishBlockchain
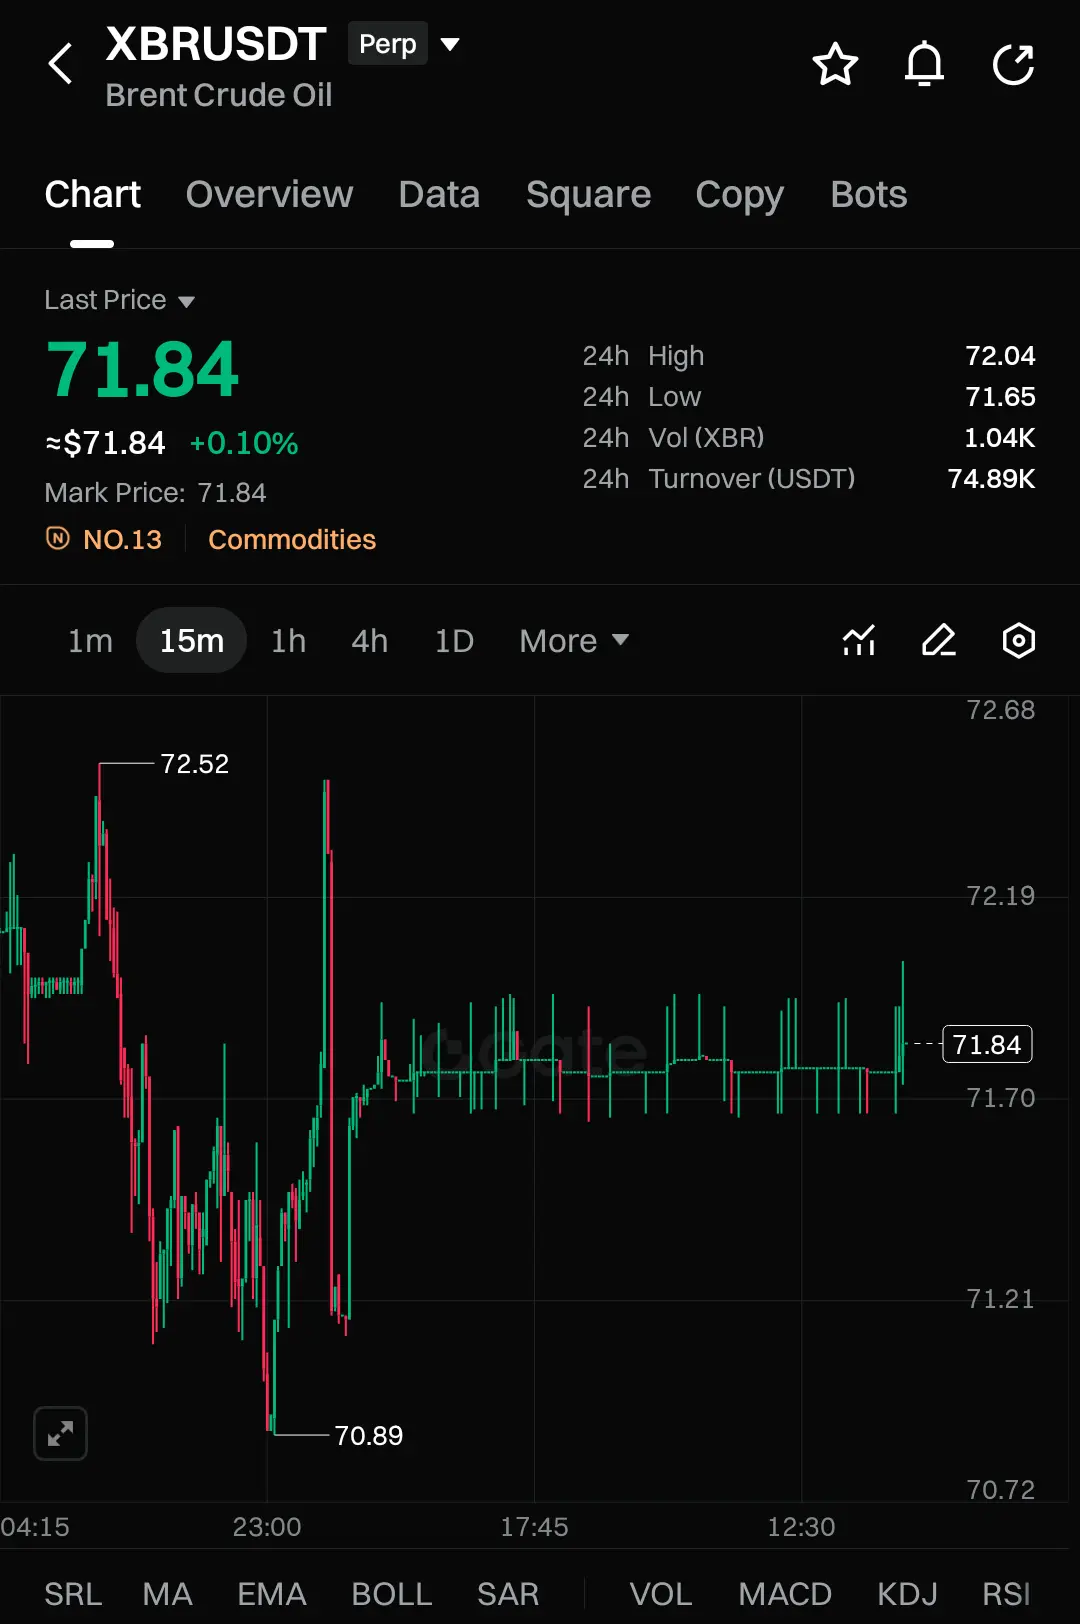
$XBR — Bullish base forming after that ugly drop. Price got washed into 70.9, then snapped back and started moving sideways. That kind of tight range usually means the market is loading, not dying. I’m watching for a clean break and hold above the range top.
Buy Zone: 71.70–71.90
Alt Buy (deeper dip): 71.20–71.35
EP: 71.84
SL: 70.85
TP1: 72.04
TP2: 72.52
TP3: 72.68
Plan: If it holds 71.70 and keeps printing higher lows, I’m riding the push into 72.5+. If it loses 71.20 and can’t reclaim fast, I step aside and wait for the next clear level. Let’s go $
#CLARITYActAdvances #USSECPushesCryptoRefo
- Reward
- 2
- Comment
- Repost
- Share
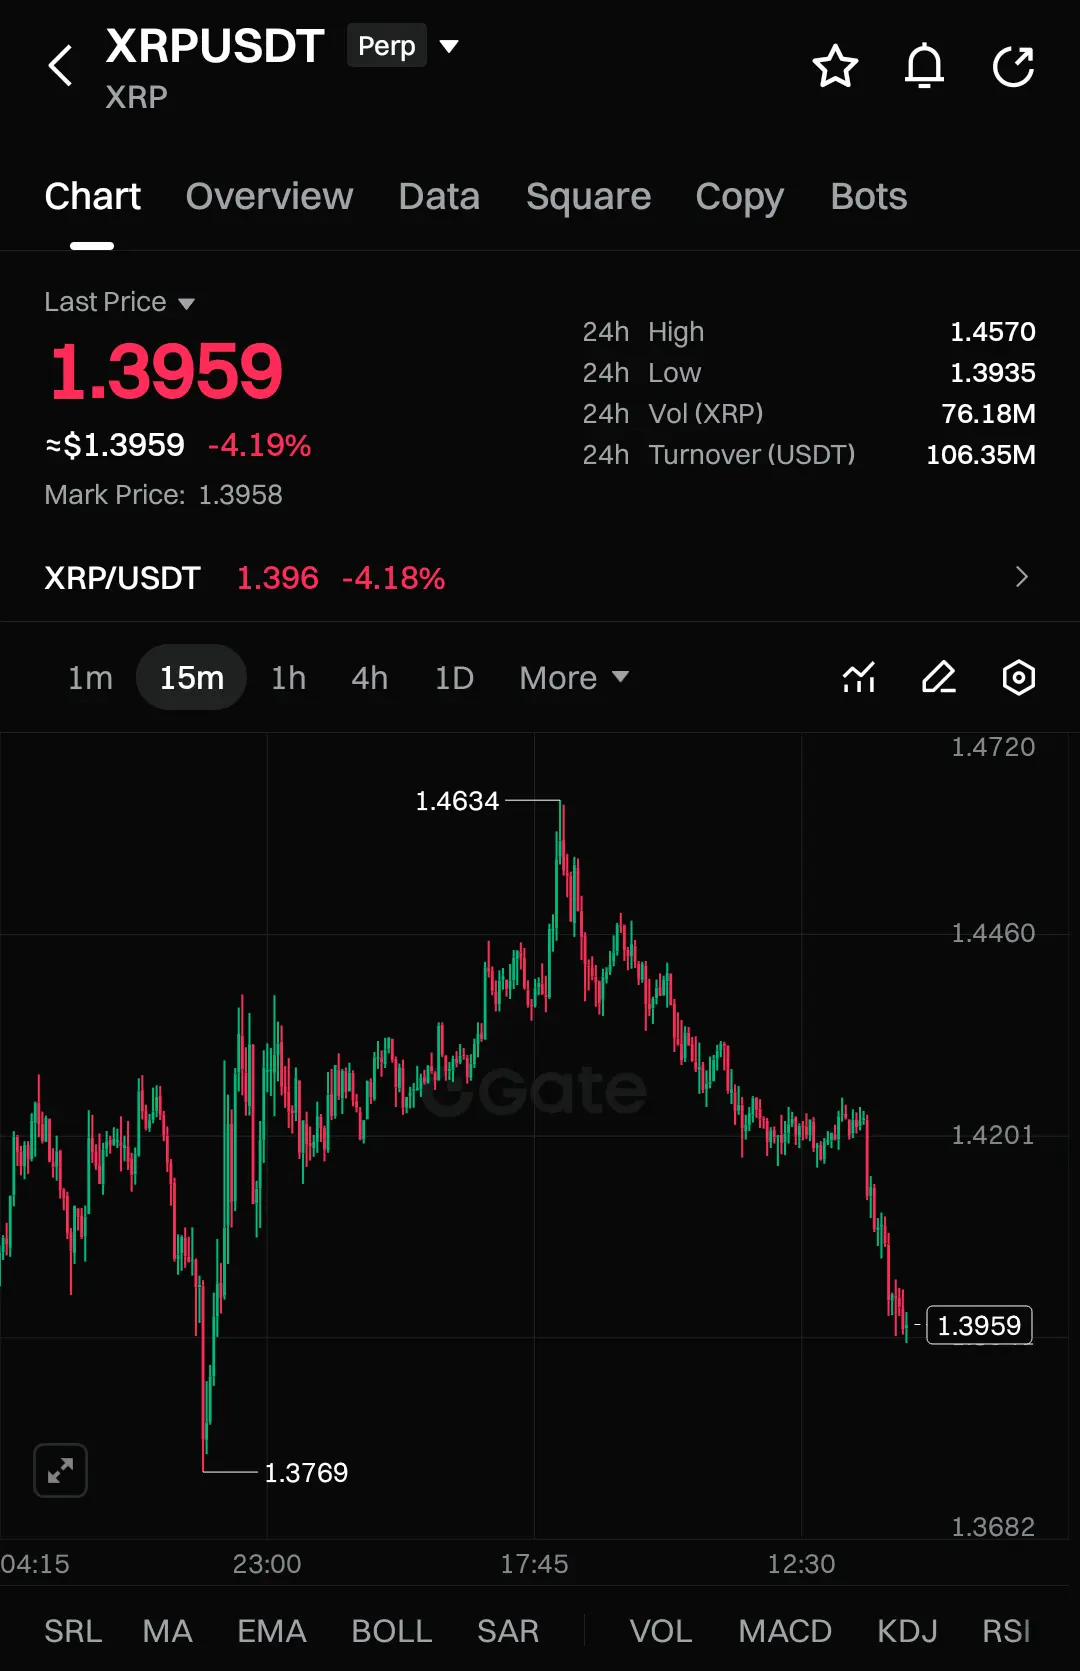
$XRP — Bullish rebound setup after a hard flush into support. This drop looks like a sweep to scare late longs, and I’m watching the 1.39 area for a clean defend and quick reclaim.
Buy Zone: 1.392–1.402
Alt Buy (deeper dip): 1.378–1.385
EP: 1.396
SL: 1.368
TP1: 1.420
TP2: 1.446
TP3: 1.463
Plan: If XRP reclaims 1.42 and holds it, I’m treating this as a dip buy and aiming for a push back toward the prior peak zone. If it loses 1.378 and can’t bounce fast, I cut it and wait for a new base. Let’s go $
#GateSquare$50KRedPacketGiveaway #CLARITYActAdvances #HongKongPlansNewVAGuidelines
XRP-3,35%
- Reward
- 2
- Comment
- Repost
- Share
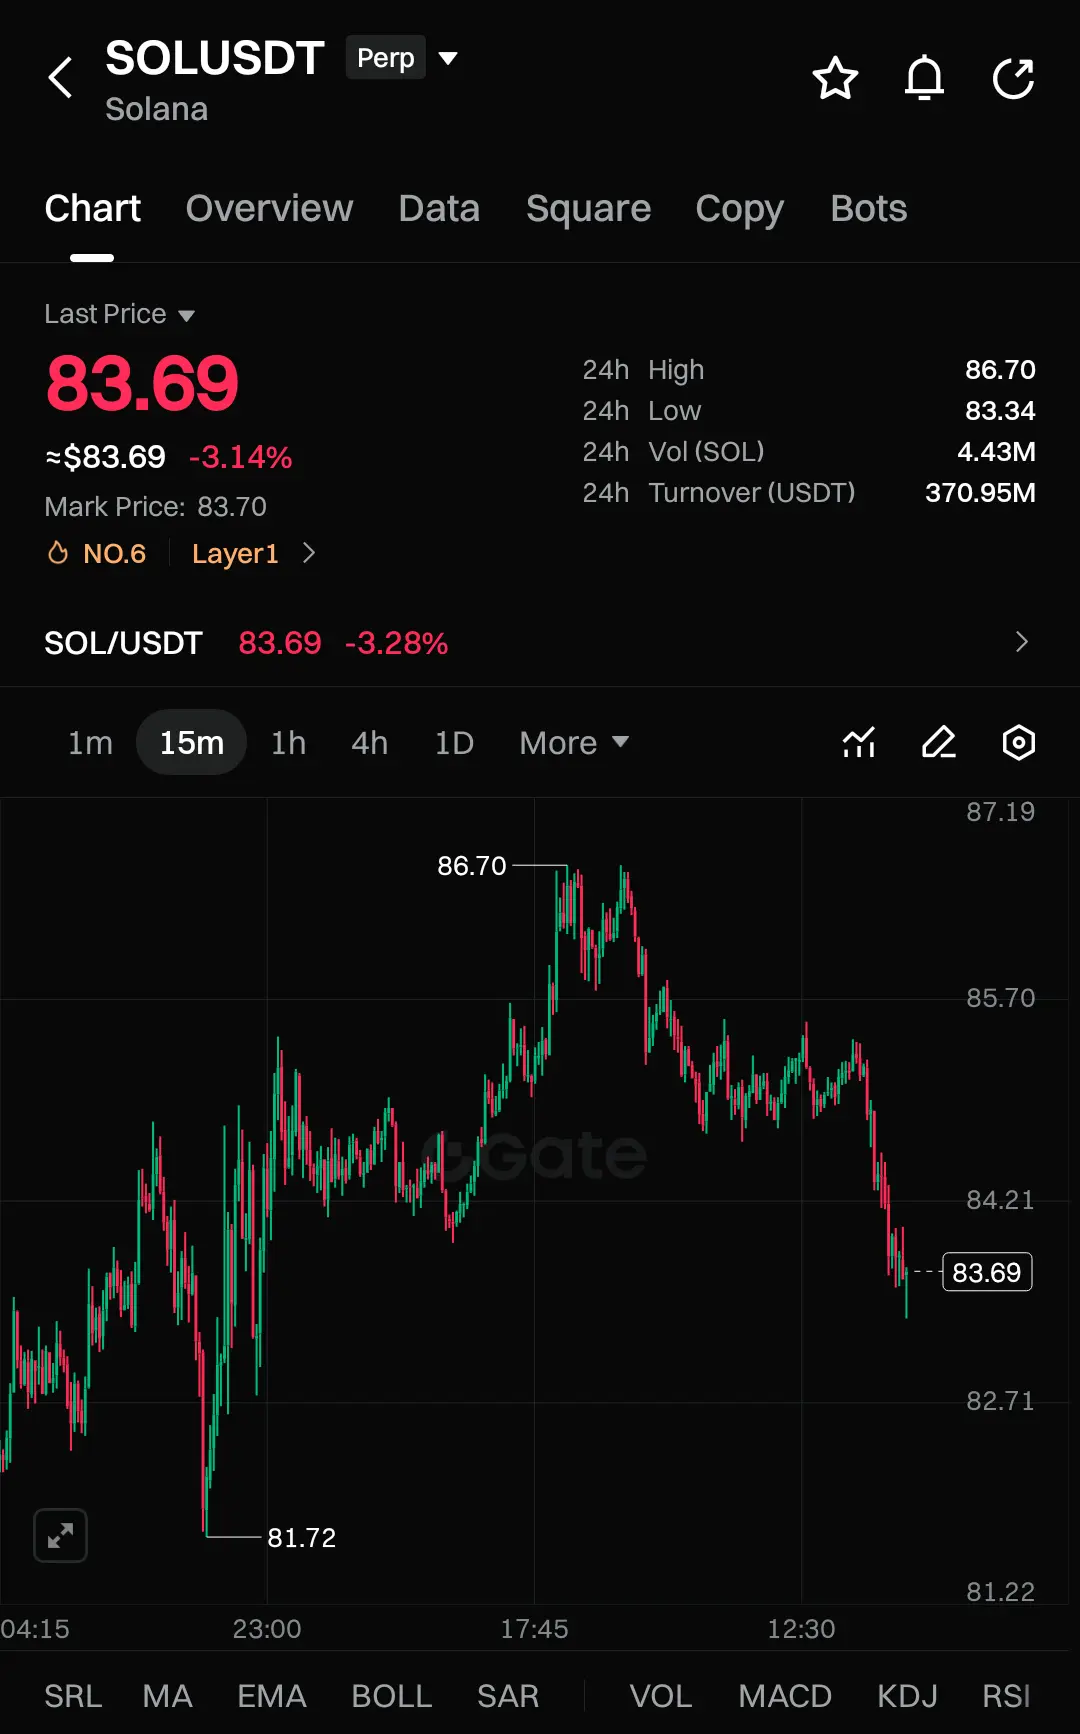
$SOL — Bullish bounce setup after a clean dump. This looks like a fast shakeout into support, and I’m looking for buyers to defend the 83 area and push it back toward the range highs.
Buy Zone: 83.20–83.80
Alt Buy (deeper dip): 82.70–82.90
EP: 83.69
SL: 81.95
TP1: 84.90
TP2: 86.10
TP3: 87.20
Plan: If SOL holds above 83 and starts reclaiming 84.20 with higher lows on 15m, I’m in for the bounce. If it breaks 82.70 and can’t recover quick, I cut it and wait for a fresh base. Let’s go $
#TrumpAnnouncesNewTariffs #USSECPushesCryptoReform #WhiteHouseTalksStablecoinYields
SOL-3,32%
- Reward
- 1
- Comment
- Repost
- Share
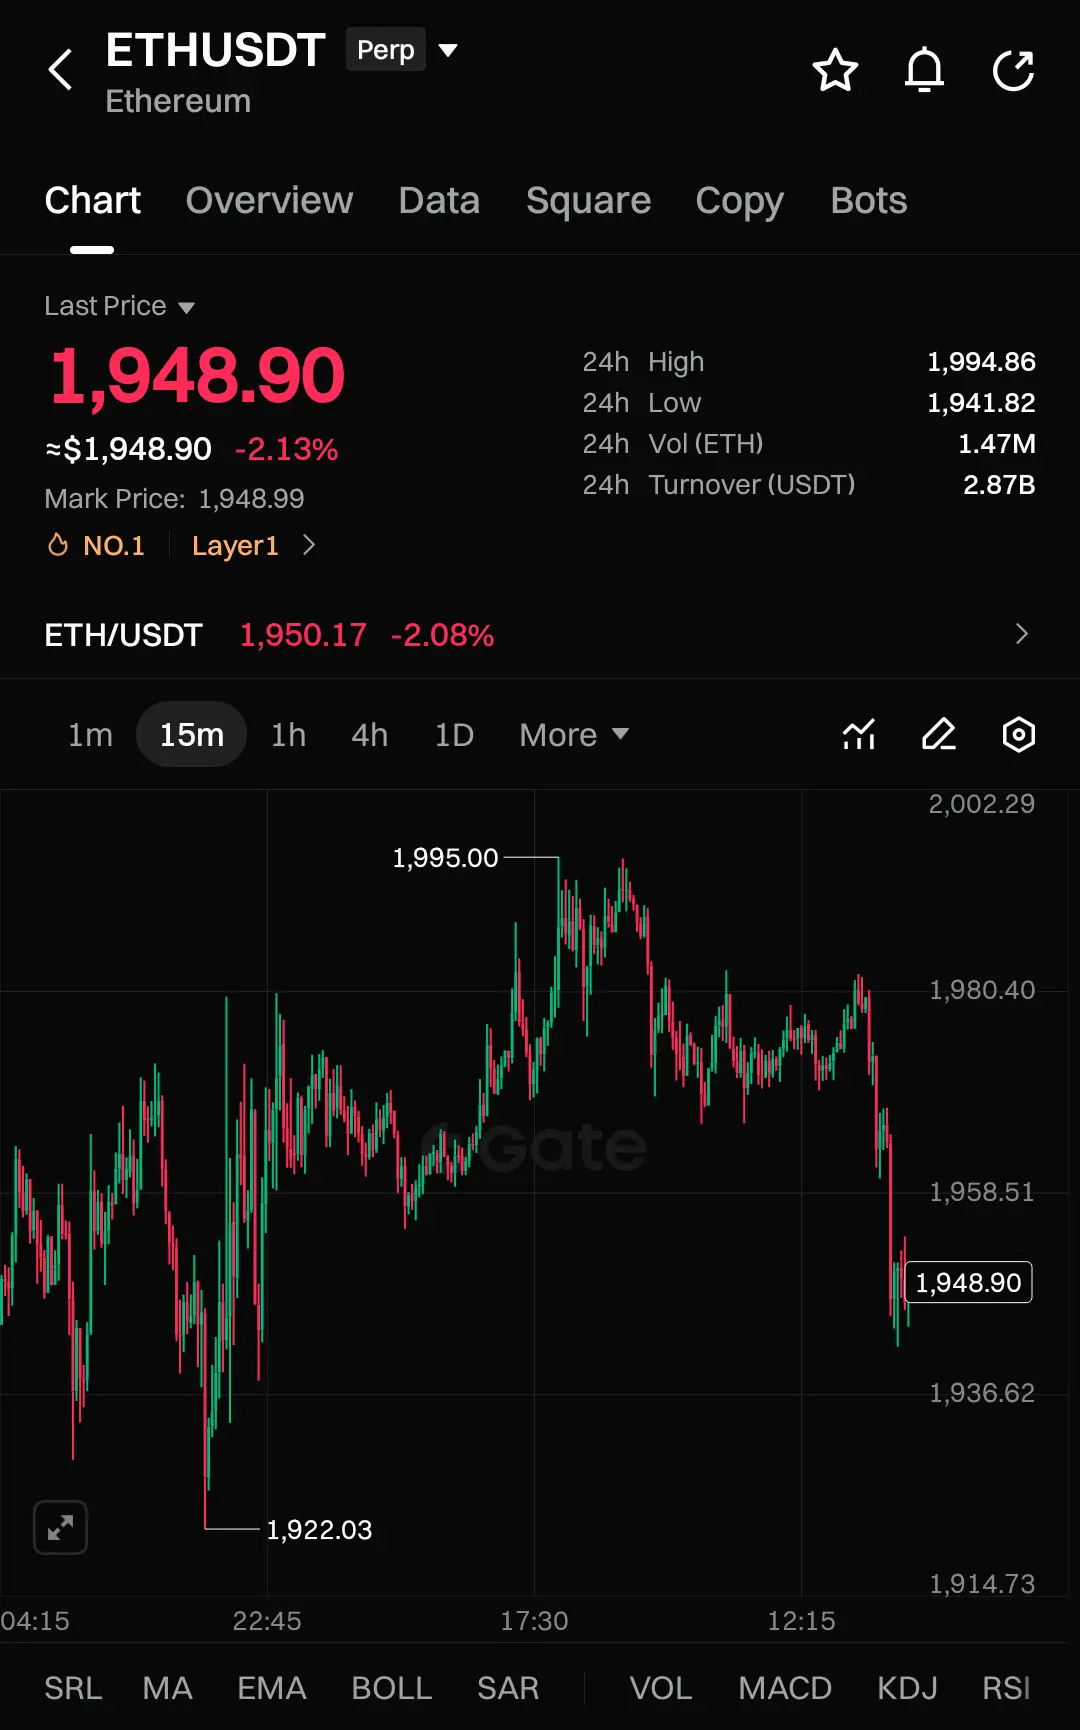
$ETH — Bullish dip-buy zone after a sharp flush. This move looks like a sweep for liquidity, not a slow bleed. I’m watching for a quick reclaim and a steady grind back above the broken level.
Buy Zone: 1,944–1,952
Alt Buy (deeper dip): 1,932–1,938
EP: 1,949
SL: 1,924
TP1: 1,972
TP2: 1,995
TP3: 2,020
Plan: If ETH holds above 1,940 and starts printing higher lows on the 15m, I’m leaning long for a bounce back to 2k. If it loses 1,924 clean, I’m out and I wait for the next base. Let’s go $
#CLARITYActAdvances #WhiteHouseTalksStablecoinYields
ETH-1,21%
- Reward
- 1
- Comment
- Repost
- Share
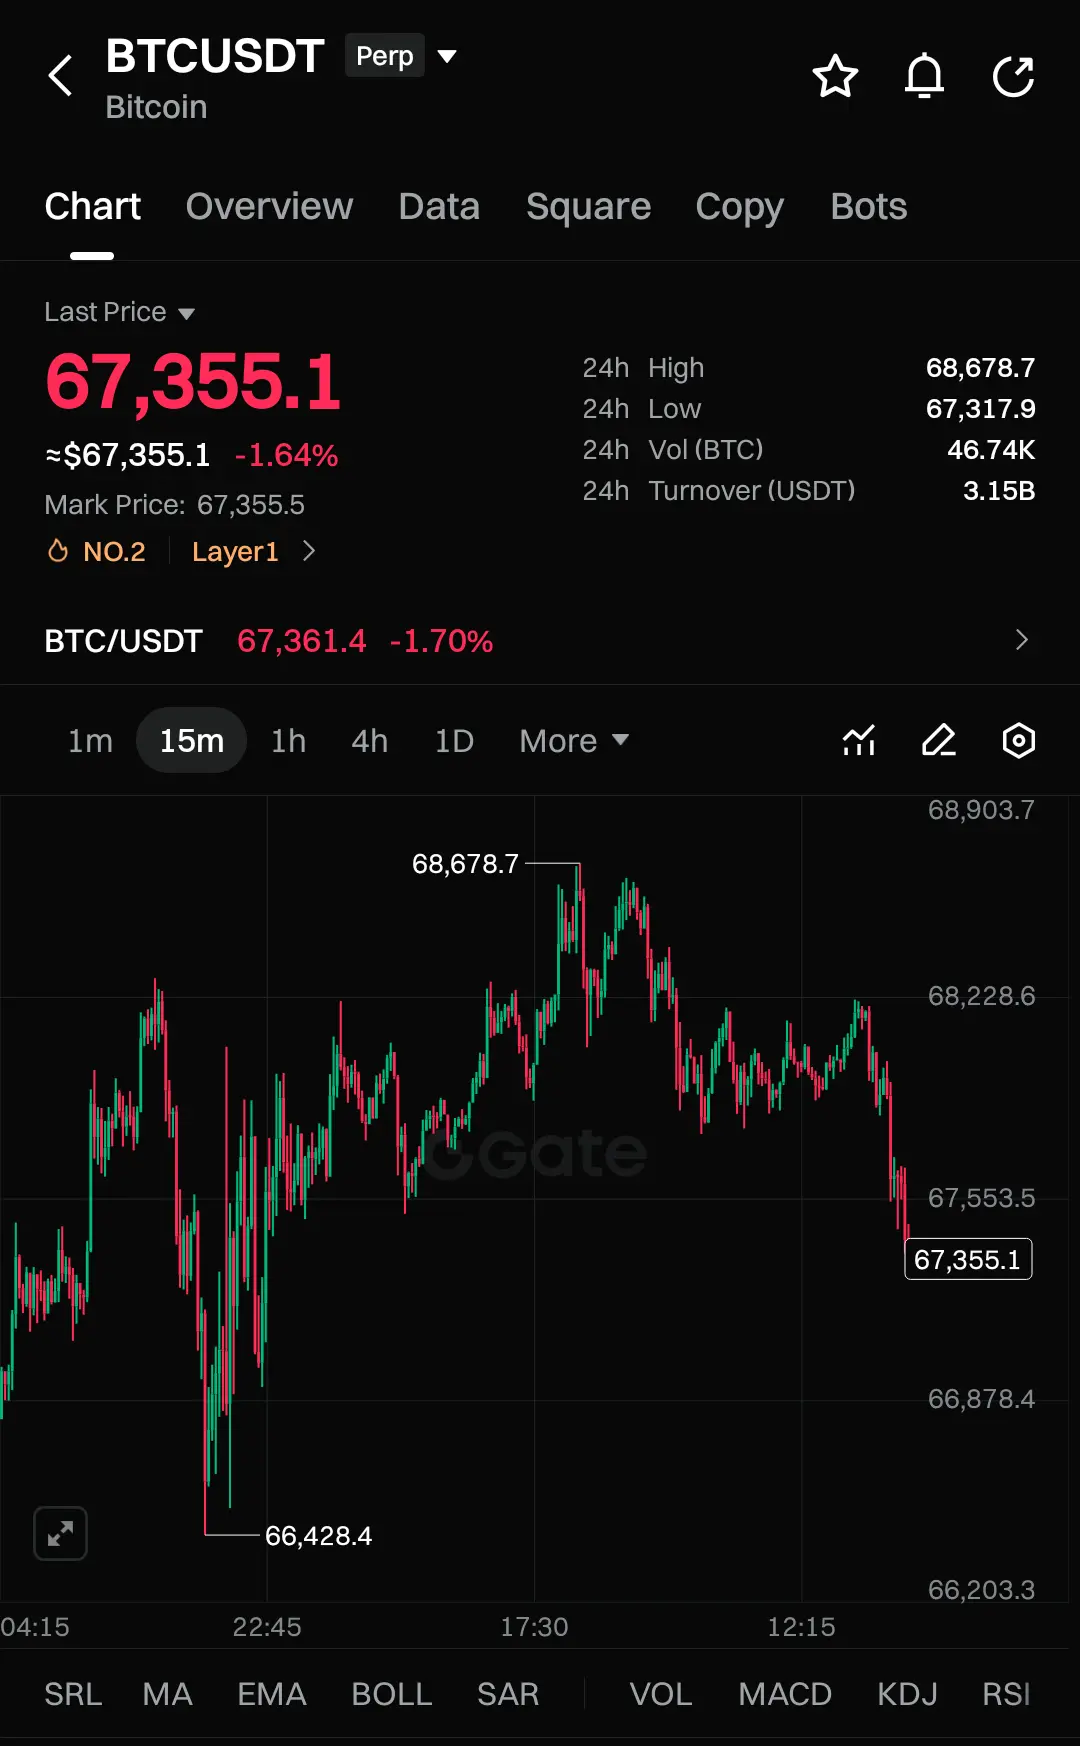
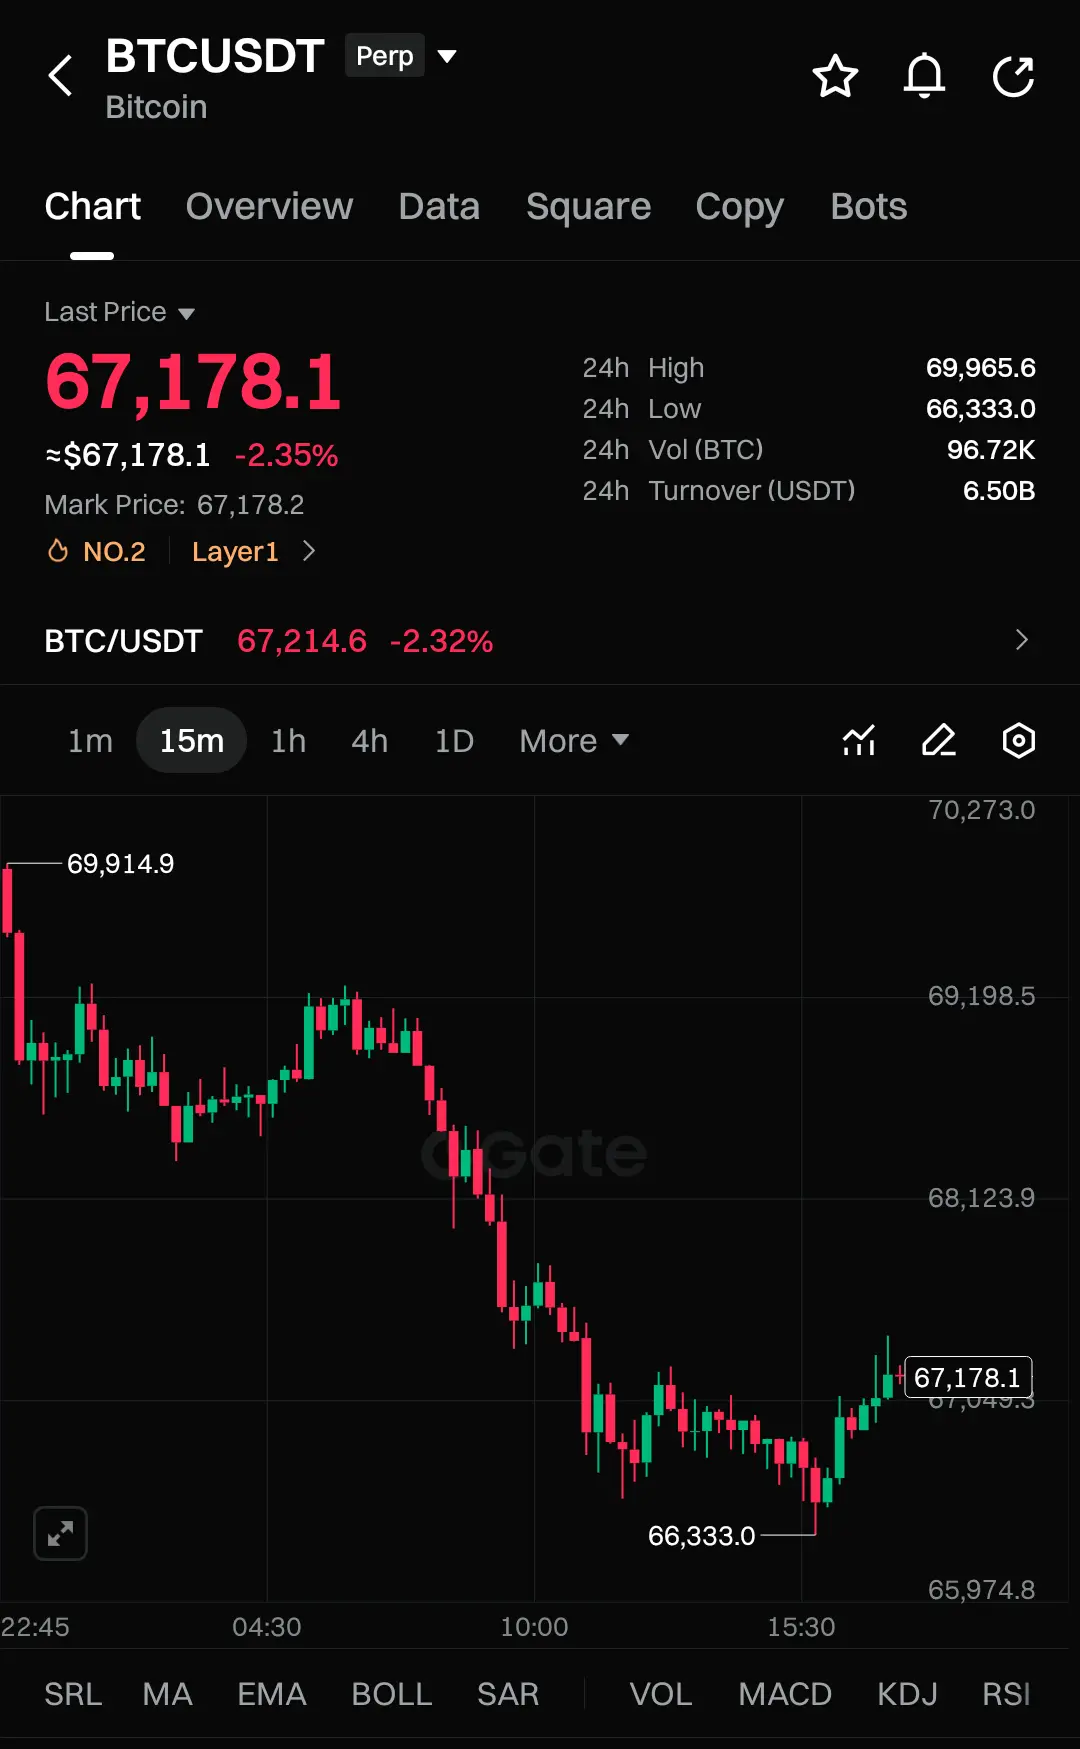
$BTC — Bullish bounce setup while price is testing the floor. Sellers pushed it down fast, but this area has already shown it can catch bids. I’m watching for a clean reaction and a tight reclaim before it runs back to the highs.
Buy Zone: 67,200–67,450
Alt Buy (deeper dip): 66,850–66,950
EP: 67,350
SL: 66,740
TP1: 68,100
TP2: 68,680
TP3: 69,200
Plan: If it holds 67.2k and starts printing higher lows, I’m treating this as a pullback, not a breakdown. If 66.7k snaps, I’m out fast and reassess. Let’s go $
#GateSquare$50KRedPacketGiveaway #WhenisBestTimetoEntertheMarket #CelebratingNewYearOnGate
BTC-0,75%
- Reward
- 2
- Comment
- Repost
- Share
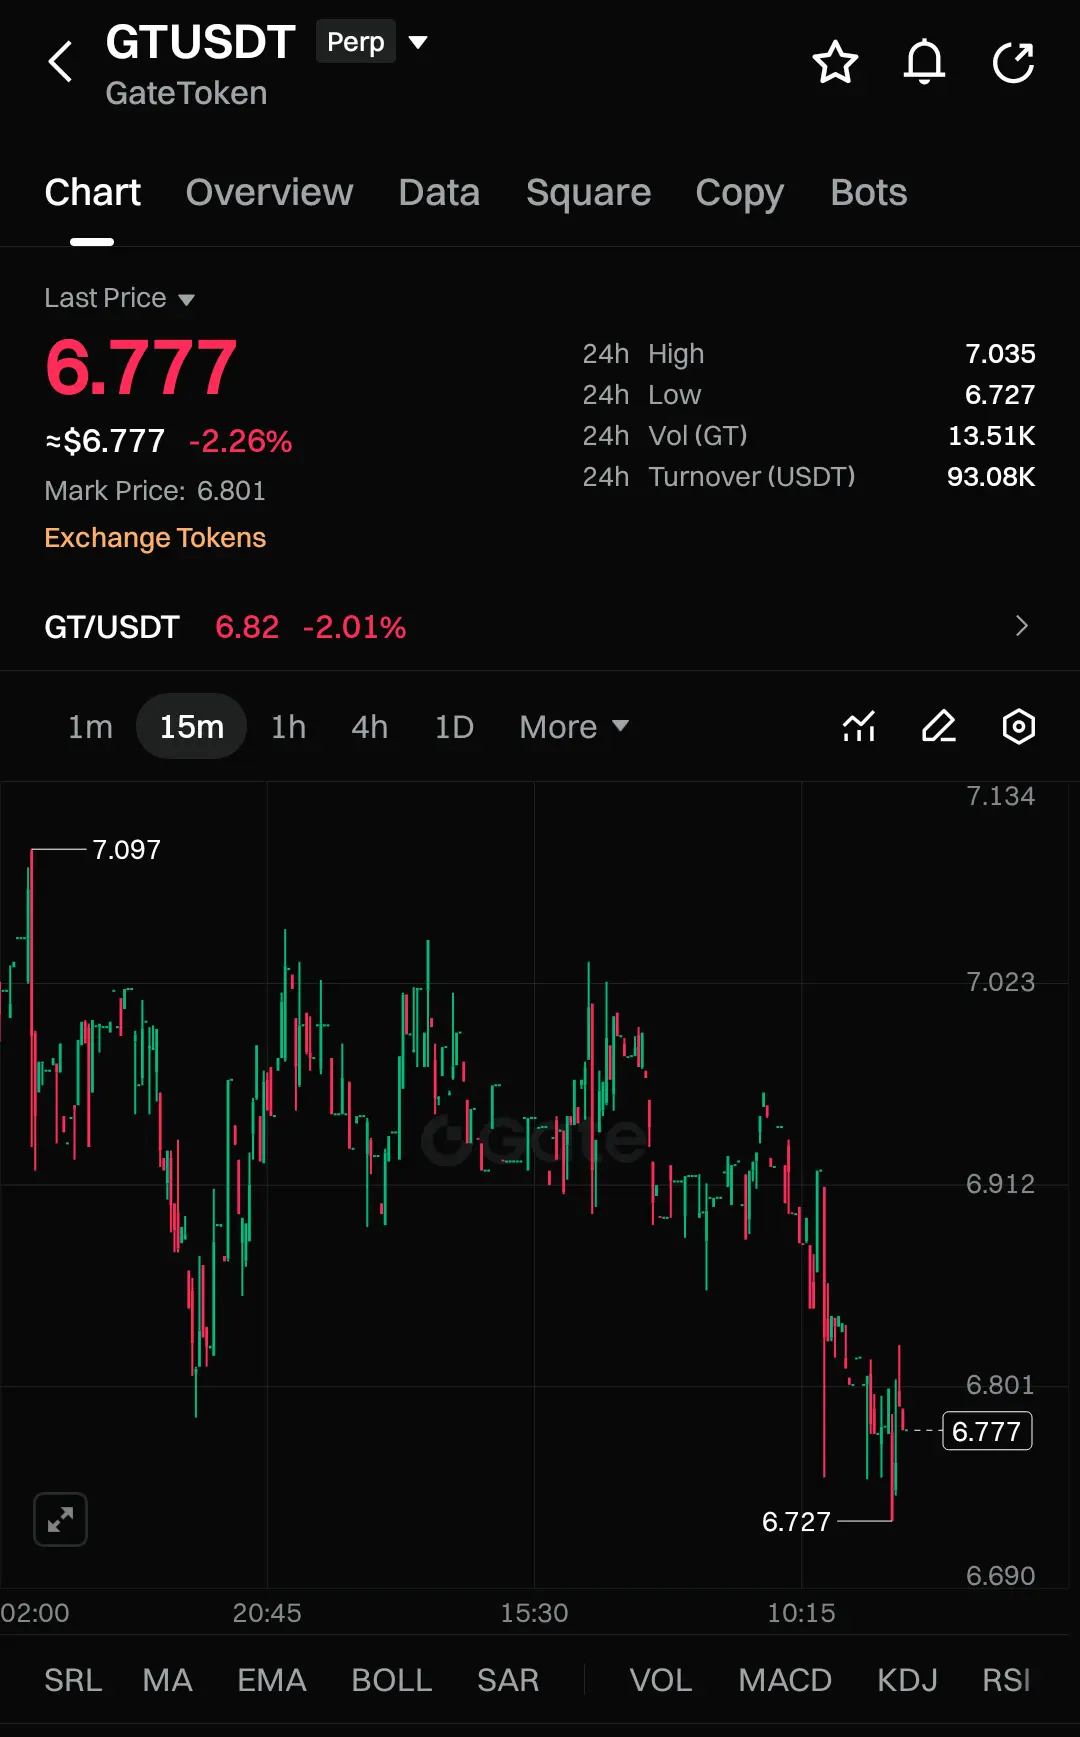
$GT is holding strong at a key demand level, and I’m watching for a reversal. Price reacted exactly at 6.87 after the recent selloff—sellers pushed hard, but there was no follow-through. That tells me this level is being defended.
On the 1H chart, price keeps bouncing between 6.87 and 7.09. The latest dip feels more like a liquidity sweep than a real breakdown. If buyers step in now, a short squeeze toward range highs is likely.
Entry Zone: 6.88 – 6.93 (with confirmation above 6.97)
Targets: TP1: 7.05 | TP2: 7.20 | TP3: 7.45
Stop Loss: 6.79
We’ve tested 6.87 multiple times without collapse—se
GT-1,65%
- Reward
- 3
- Comment
- Repost
- Share
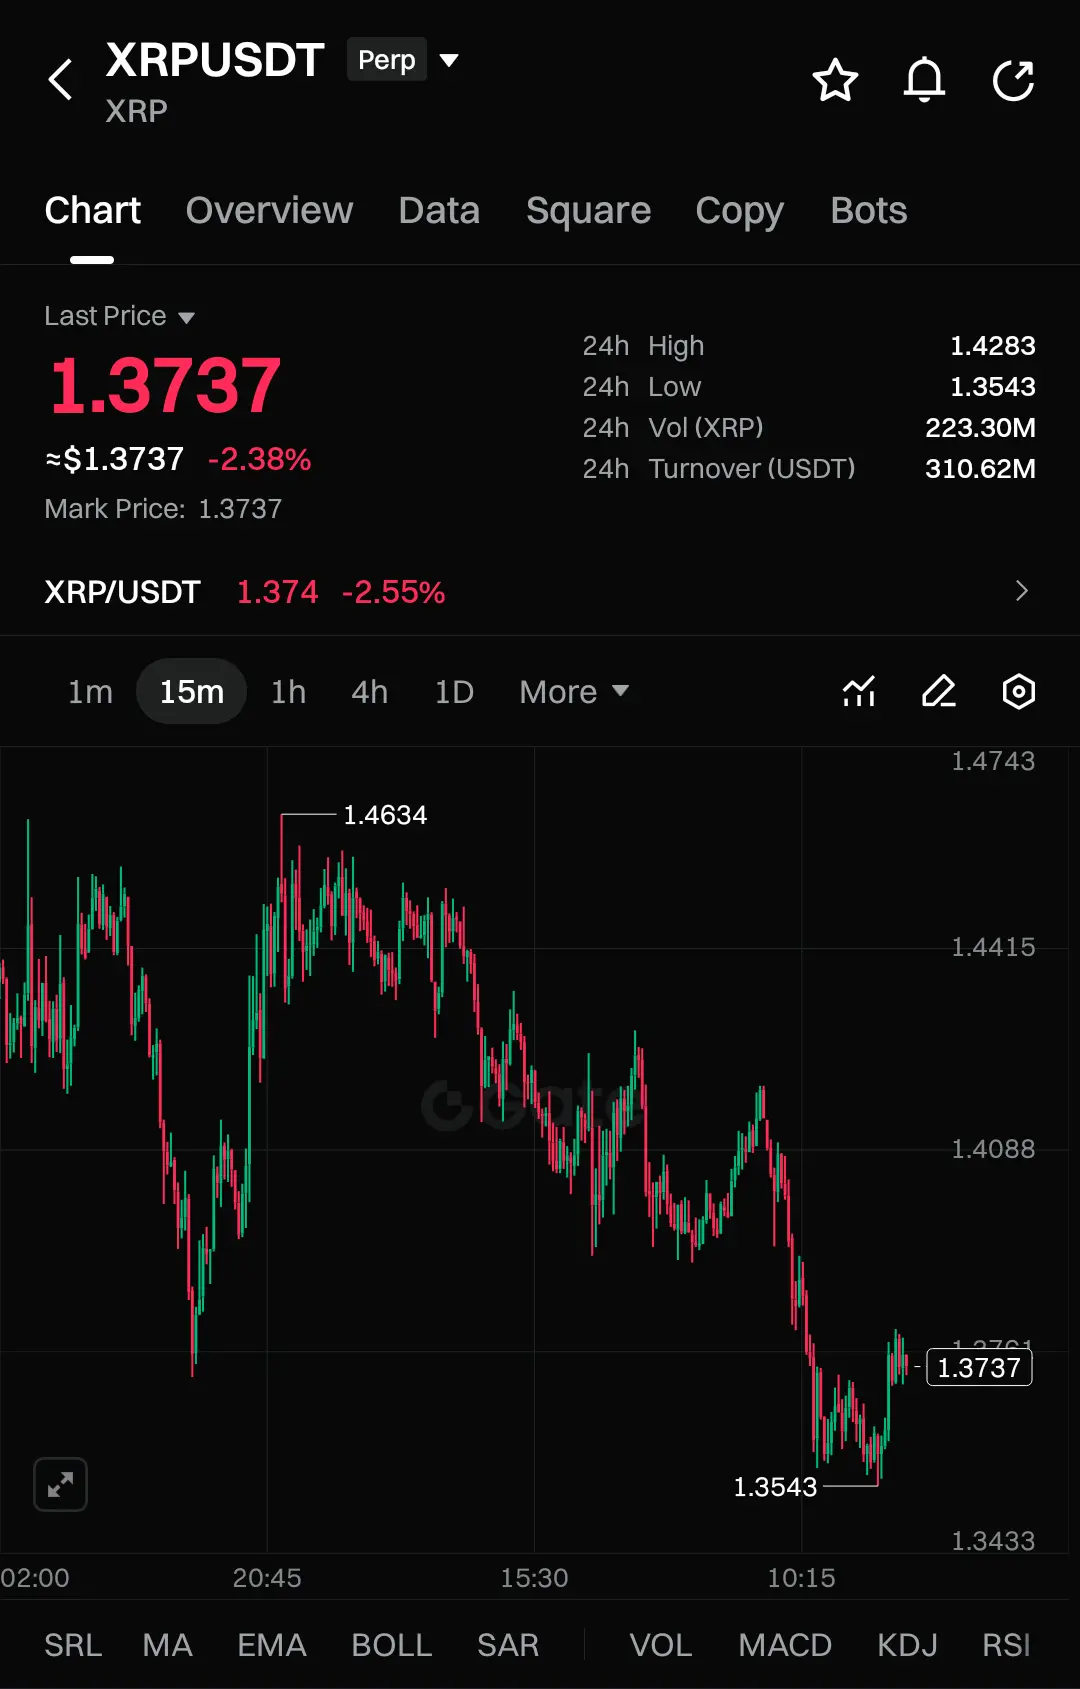
$XRP (XRP_USDT) is showing clear downside momentum after being rejected from recent highs. Sellers are in control, with the structure making consistent lower highs and lower lows.
Entry Zone: 1.365 – 1.385
Targets: TP1: 1.340 | TP2: 1.310 | TP3: 1.280
Stop Loss: 1.425
Liquidity got swept below 1.358, causing a small bounce, but the overall picture remains bearish. Any pullback into the entry zone could give another chance for continuation toward lower liquidity pockets if selling pressure stays strong.
The market is clearly favoring the bears—watch your zones and plan accordingly.
#BuyTheDipO
XRP-3,35%
- Reward
- like
- Comment
- Repost
- Share
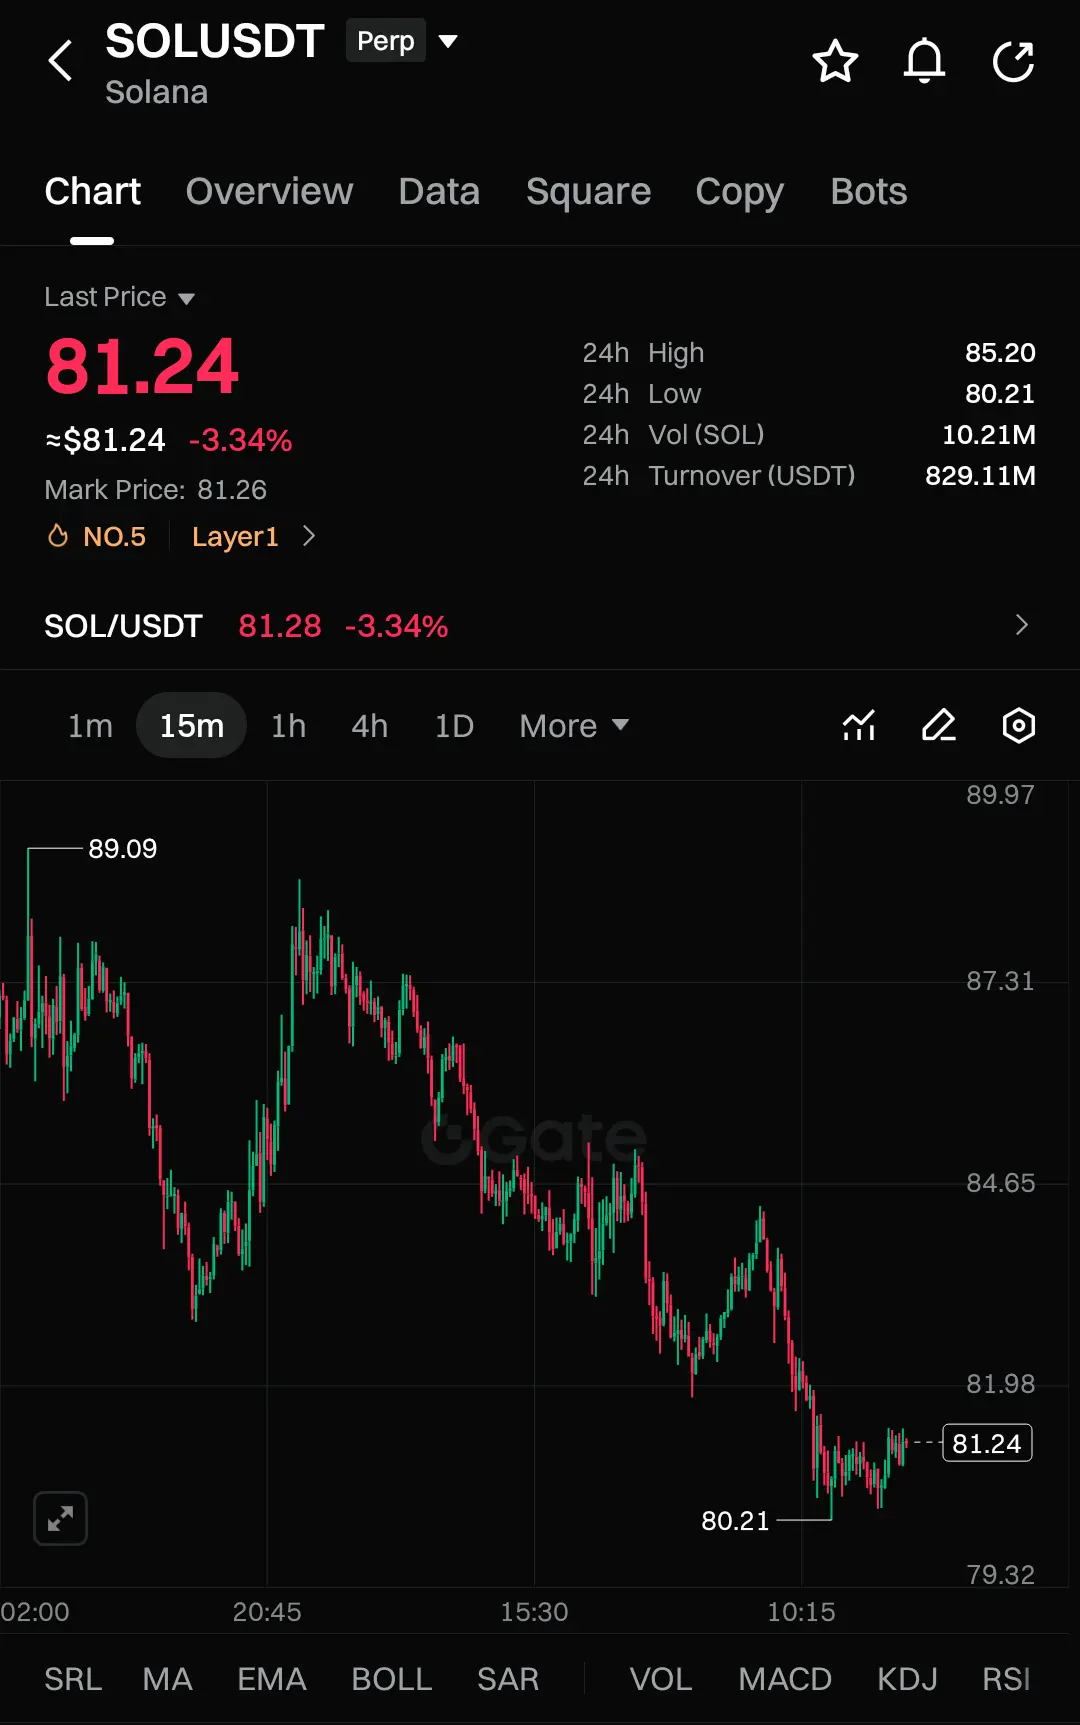
$SOL (SOL_USDT) is feeling steady selling pressure after being rejected at local highs. Sellers are clearly in control, with lower highs forming and key supports breaking.
Entry Zone: 81.00 – 82.20
Targets: TP1: 79.80 | TP2: 78.50 | TP3: 76.80
Stop Loss: 84.50
We saw liquidity swept below 80.59 with a small bounce, but the overall structure stays bearish. Any pullback into the entry zone could be a good chance for continuation toward lower liquidity pockets, as long as sellers keep pressure on.
The trend is clear—watch the zones and play it smart.
#WalshSaysToCautiouslyShrinkBalanceSheet #Cel
SOL-3,32%
- Reward
- like
- Comment
- Repost
- Share
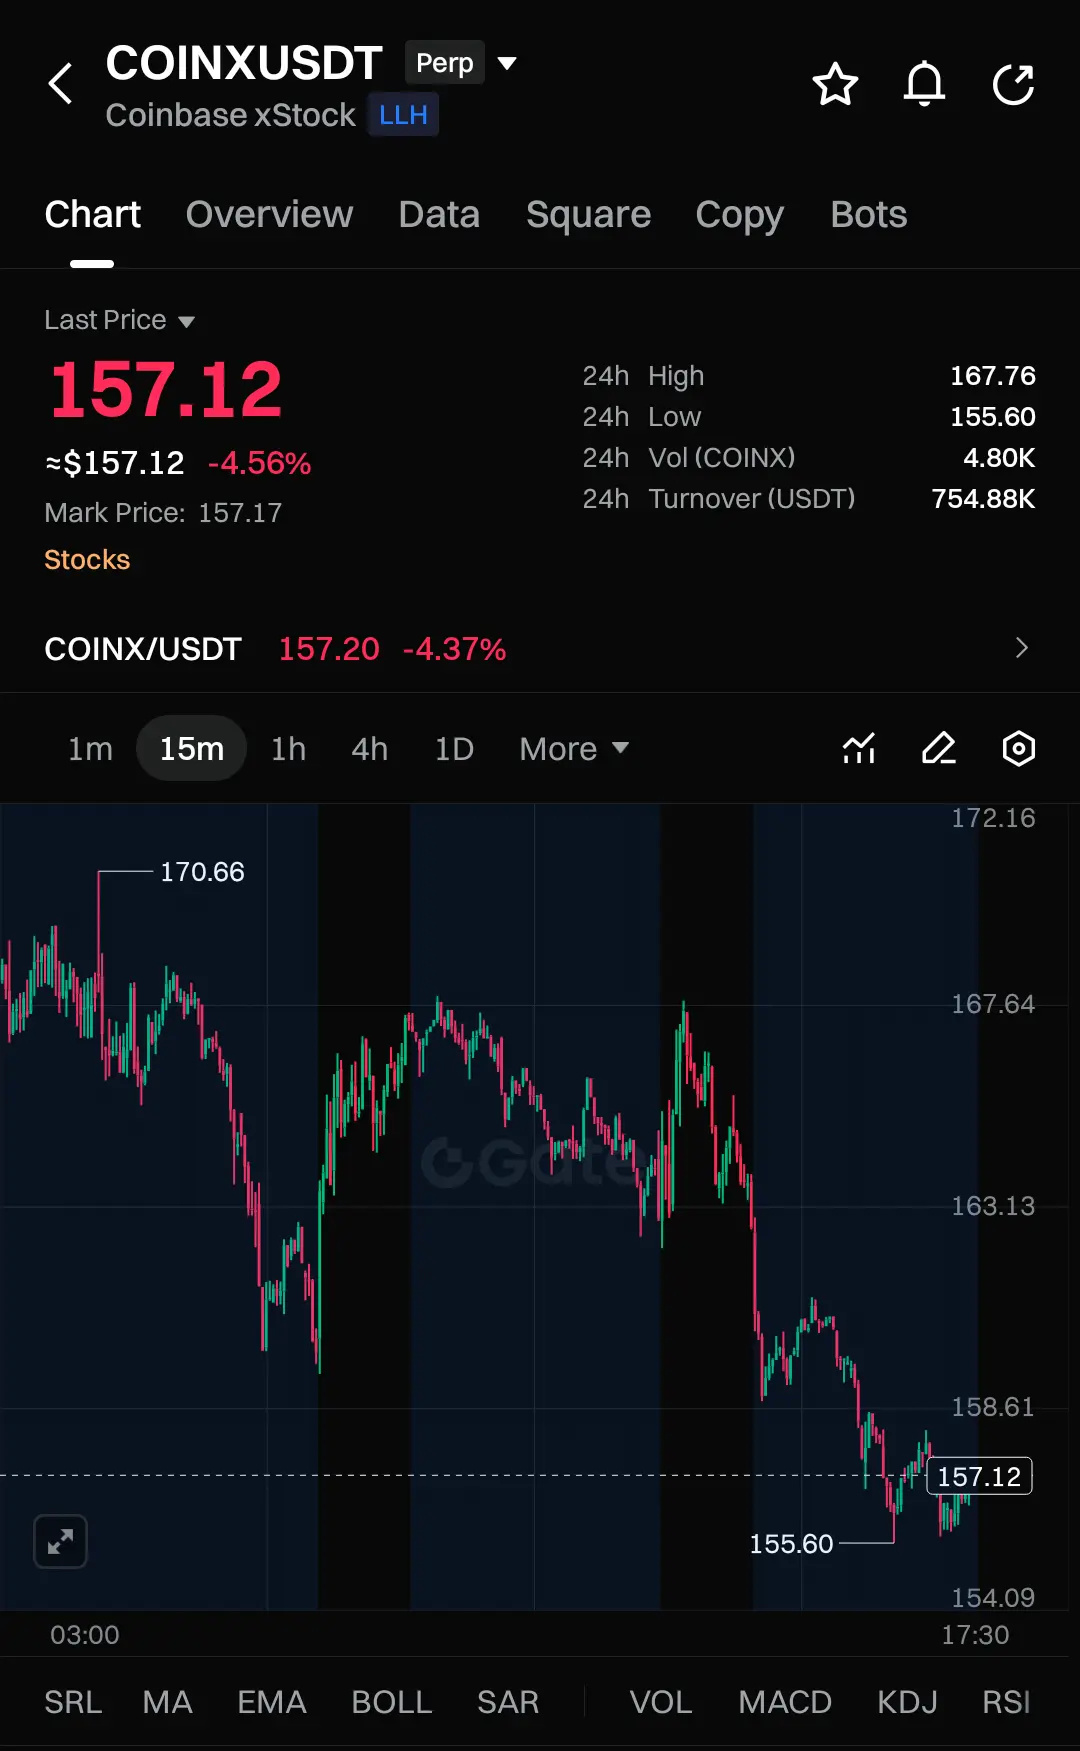
$COINX (COINX_USDT) just broke out from its base and is now holding strong above the breakout level. Momentum is still alive, so this could be a nice ride if it keeps up.
Buy Zone: 0.0328 – 0.0334
Targets: TP1: 0.0345 | TP2: 0.0360 | TP3: 0.0385
Stop Loss: 0.0309
Keep an eye on the price action—holding above the breakout is key for continuation.
#BuyTheDipOrWaitNow? #WhiteHouseTalksStablecoinYields #USIranNuclearTalksTurmoil #StrategyBuys1,142BTC
Buy Zone: 0.0328 – 0.0334
Targets: TP1: 0.0345 | TP2: 0.0360 | TP3: 0.0385
Stop Loss: 0.0309
Keep an eye on the price action—holding above the breakout is key for continuation.
#BuyTheDipOrWaitNow? #WhiteHouseTalksStablecoinYields #USIranNuclearTalksTurmoil #StrategyBuys1,142BTC
COINX-0,75%
- Reward
- like
- Comment
- Repost
- Share
$BTC has lost its recent range and is slowly drifting down toward the $66K support. We could see a bounce from here, but let’s not mistake it for a full recovery just yet. The market still needs clear strength and confirmation before we can call it bullish again. Patience is key right now—watch the levels, and don’t rush the trend.
#WhiteHouseTalksStablecoinYields #WalshSaysToCautiouslyShrinkBalanceSheet #GateSquareValentineGiveaway
#WhiteHouseTalksStablecoinYields #WalshSaysToCautiouslyShrinkBalanceSheet #GateSquareValentineGiveaway
BTC-0,75%
- Reward
- like
- Comment
- Repost
- Share
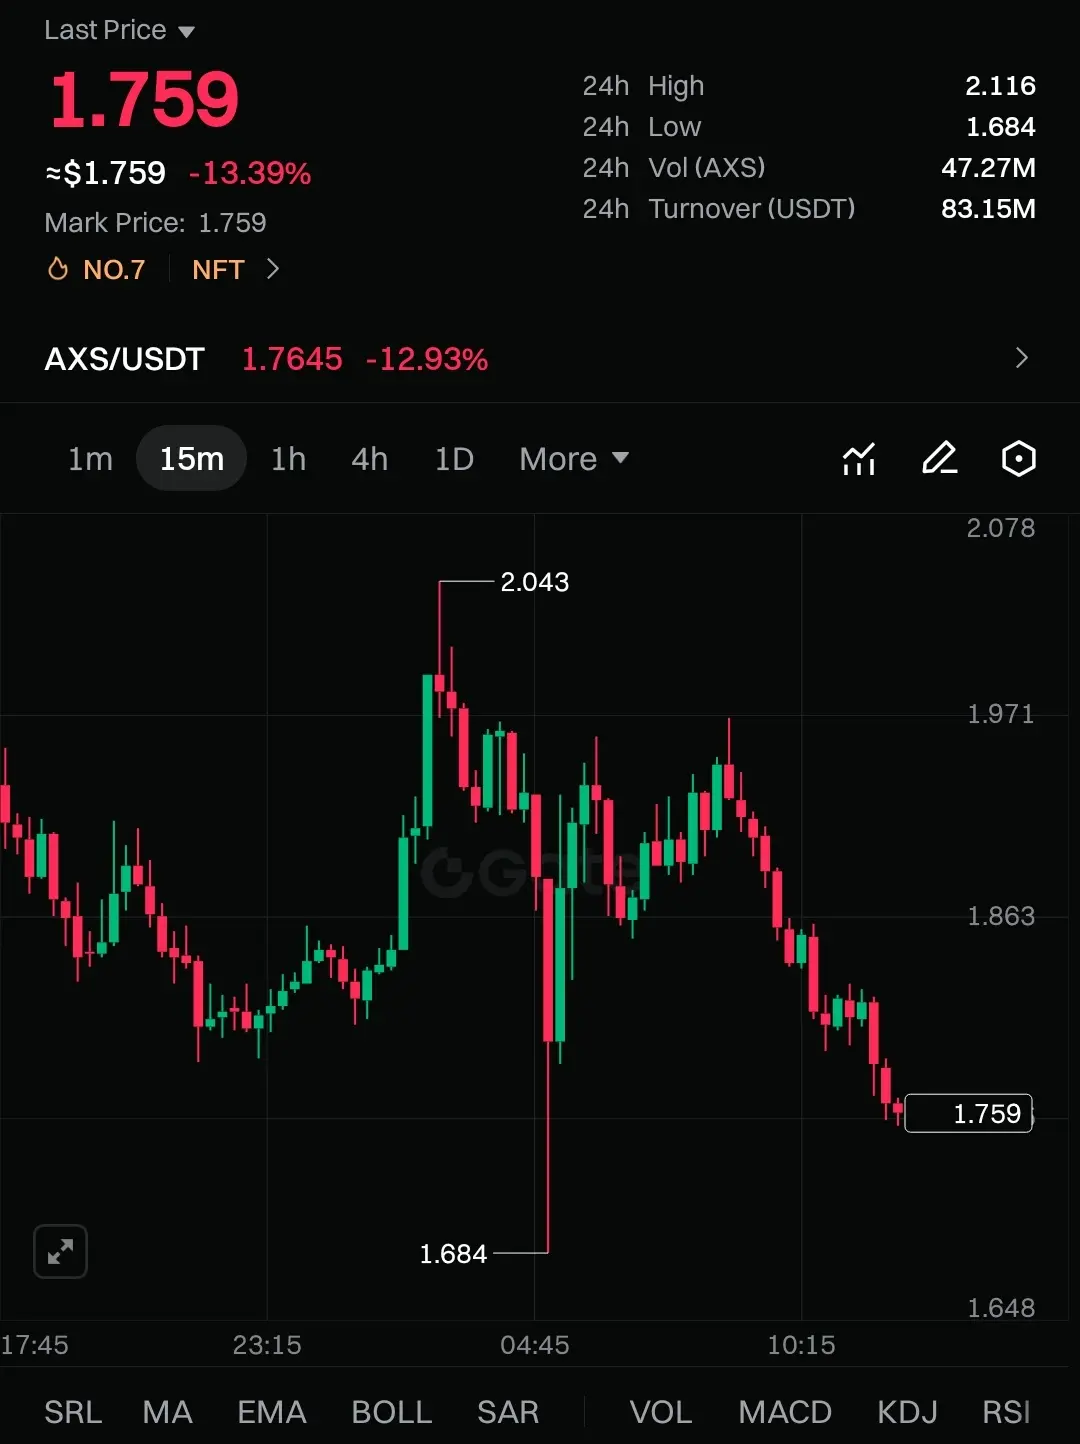
$AXS is still on fire, and the chart is showing real strength.
After a strong +48% run, price got rejected near 2.162, but the important part is what happened next. It didn’t collapse. Instead, it’s holding higher lows around the 2.00 area. That tells me buyers are still in control and are defending dips with confidence.
This makes the pullback interesting, not scary. The zone between 1.98 and 2.02 looks like a clean area where buyers may step in again. As long as price holds here, momentum stays on our side.
If the bounce comes, the first move is toward 2.08. A clean push through that opens
AXS-4,9%
- Reward
- 1
- Comment
- Repost
- Share
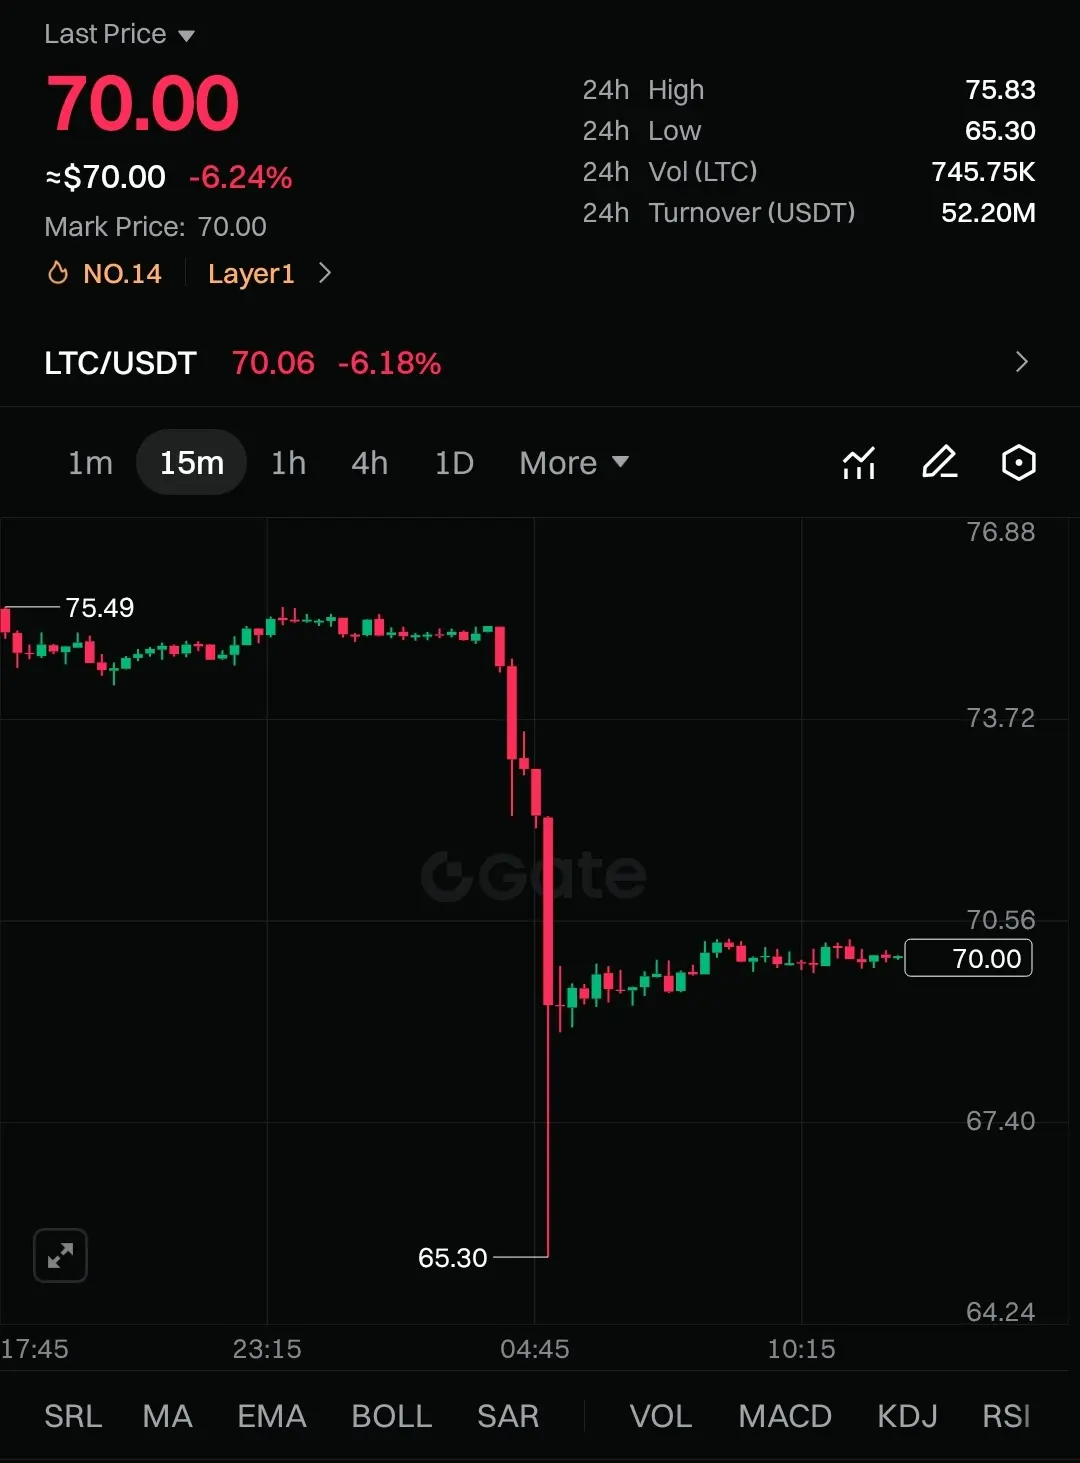
$LTC is sitting right where things get interesting.
Price is hovering around 74.4 after getting rejected near 75.1, and this zone has real importance. It’s a key support area, and so far, buyers are showing up. If they continue to defend this level, the bounce can be quick and sharp.
This is a clean scalp setup with clear levels and tight risk. Entries between 74.10 and 74.50 make sense while price holds support. If momentum kicks in, the first push is toward 75.10, and from there it can extend to 76.00 and even 76.80 if buyers stay aggressive.
The stop at 73.60 keeps risk controlled. If supp
LTC-2,59%
- Reward
- like
- Comment
- Repost
- Share
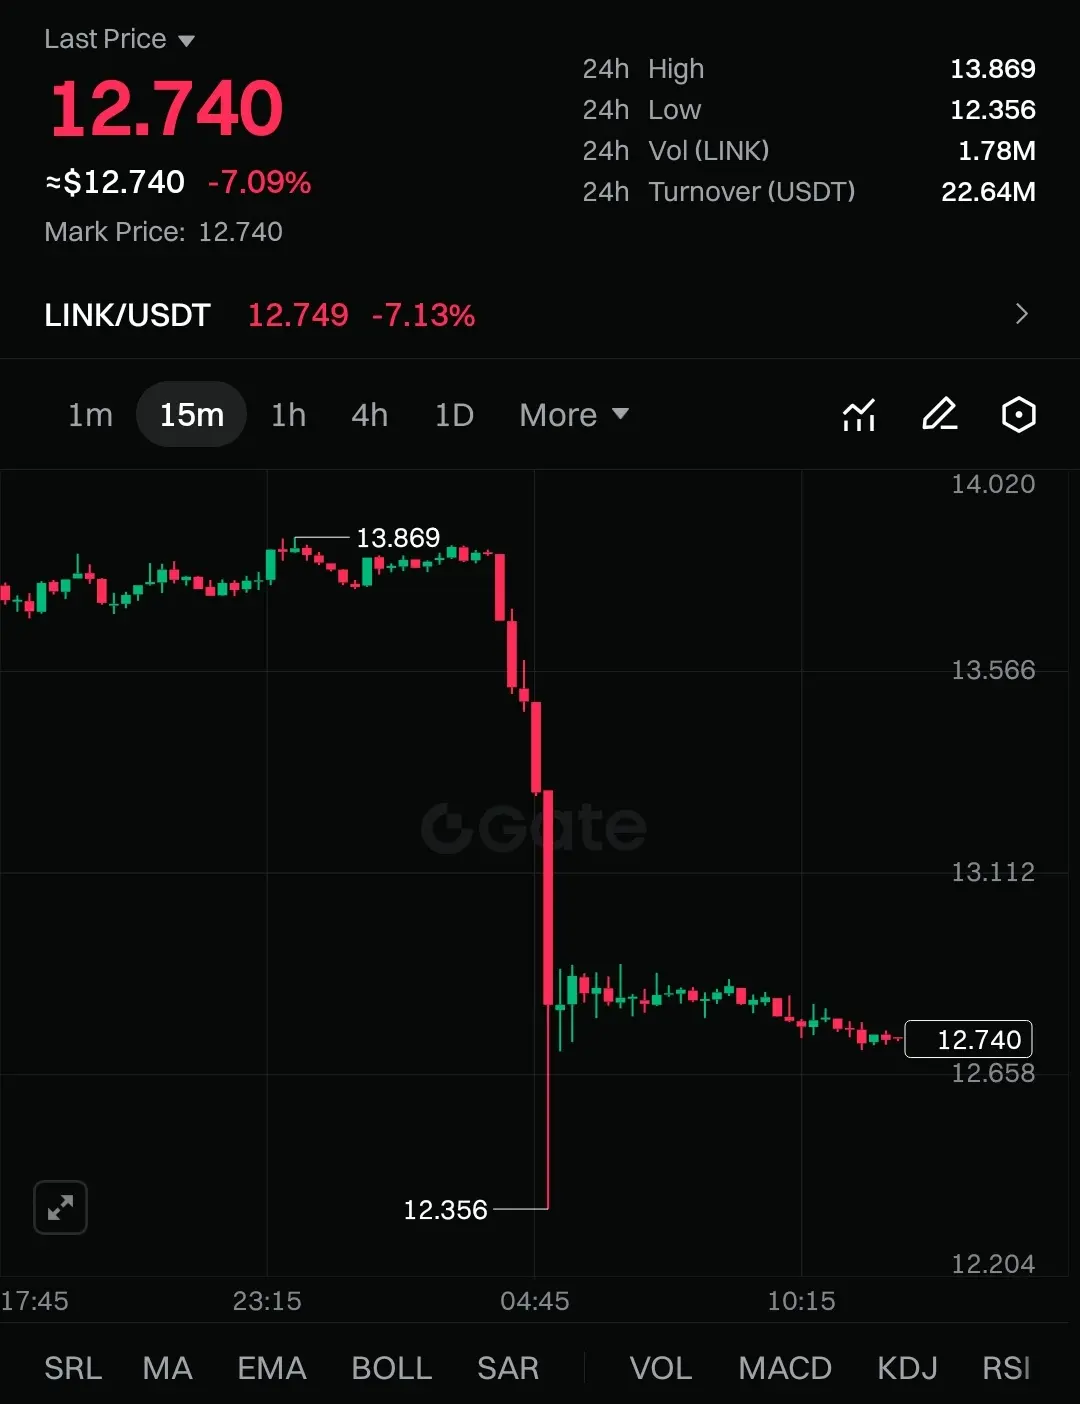
$LINK is sitting at a very interesting place on the 2-week chart.
The lower boundary of the long-term triangle is still holding strong. This level has been tested before, and each time buyers have stepped in quietly. That tells me this support matters more than most people think.
When price respects a structure for this long, the reaction from it can be powerful. If LINK manages a clean reversal from this zone, the upside opens up fast. A sustained move could send price toward the 51 area, which lines up with higher-timeframe resistance and previous market memory.
For now, this is not about c
LINK-2,32%
- Reward
- like
- Comment
- Repost
- Share
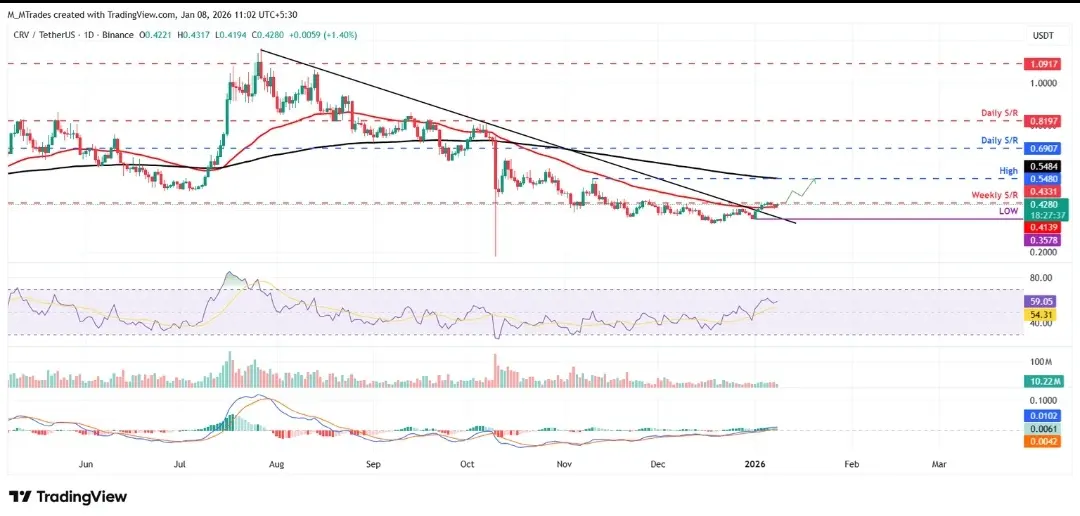
$CRV is finally waking up, and the chart feels different this time.
After months of pressure, price has broken out of the long-term descending structure. That alone is a big deal. What really matters is what came next. CRV is now moving inside a rising channel on the 4H chart. This tells me the rhythm has changed. Sellers are no longer in control. Buyers are stepping in with confidence.
Right now, everything comes down to one zone. The 0.44 to 0.46 area is heavy supply. Price has been rejected here before, so this is not an easy level. This is the moment where the market shows its hand.
If CR
CRV-3,07%
- Reward
- like
- 1
- Repost
- Share
EachTime,ItGetsBetterThanThe :
:
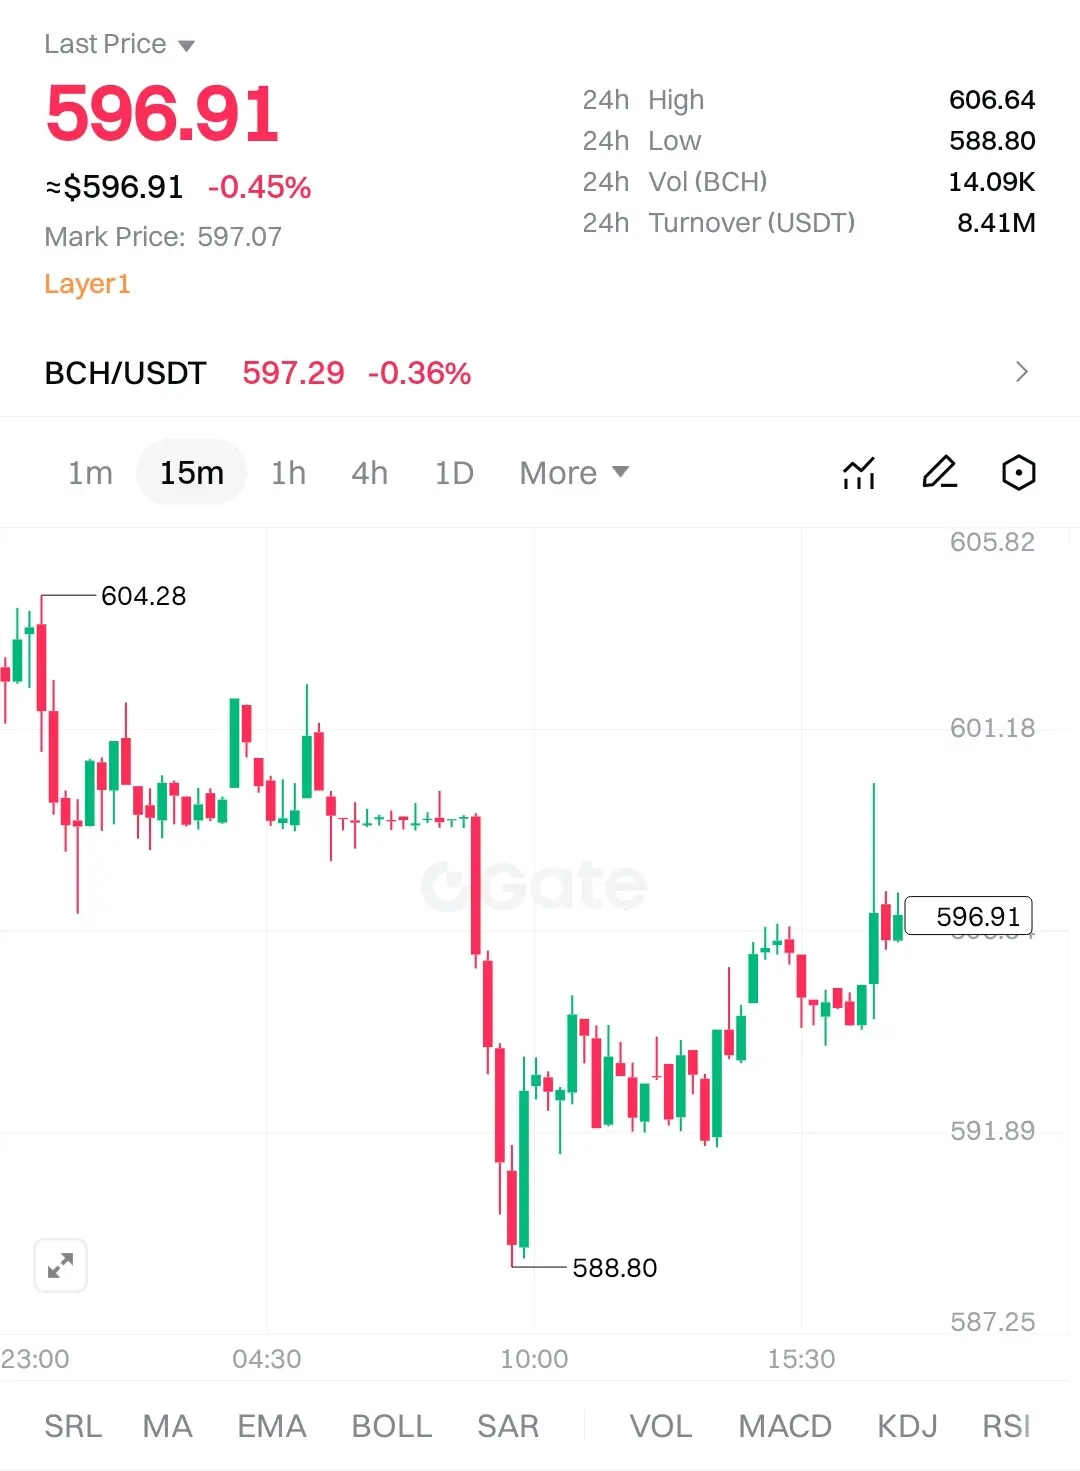
Now then$BCH /USDT
BCH pulled back sharply after failing to hold local highs and is now stabilizing around $590–$585. Price is hovering near the short-term moving averages, showing hesitation but no panic, which tells me sellers are slowing down. This zone is key because buyers already stepped in near $575, and that demand is still active.
If $585 holds, we could see a clean bounce toward $600–$610, where liquidity is waiting. A strong push above $600 would shift momentum back to the bulls. On the other hand, dropping below $585 could lead to a deeper sweep toward $575 support.
Volatility is high and
BCH0,71%
- Reward
- like
- Comment
- Repost
- Share
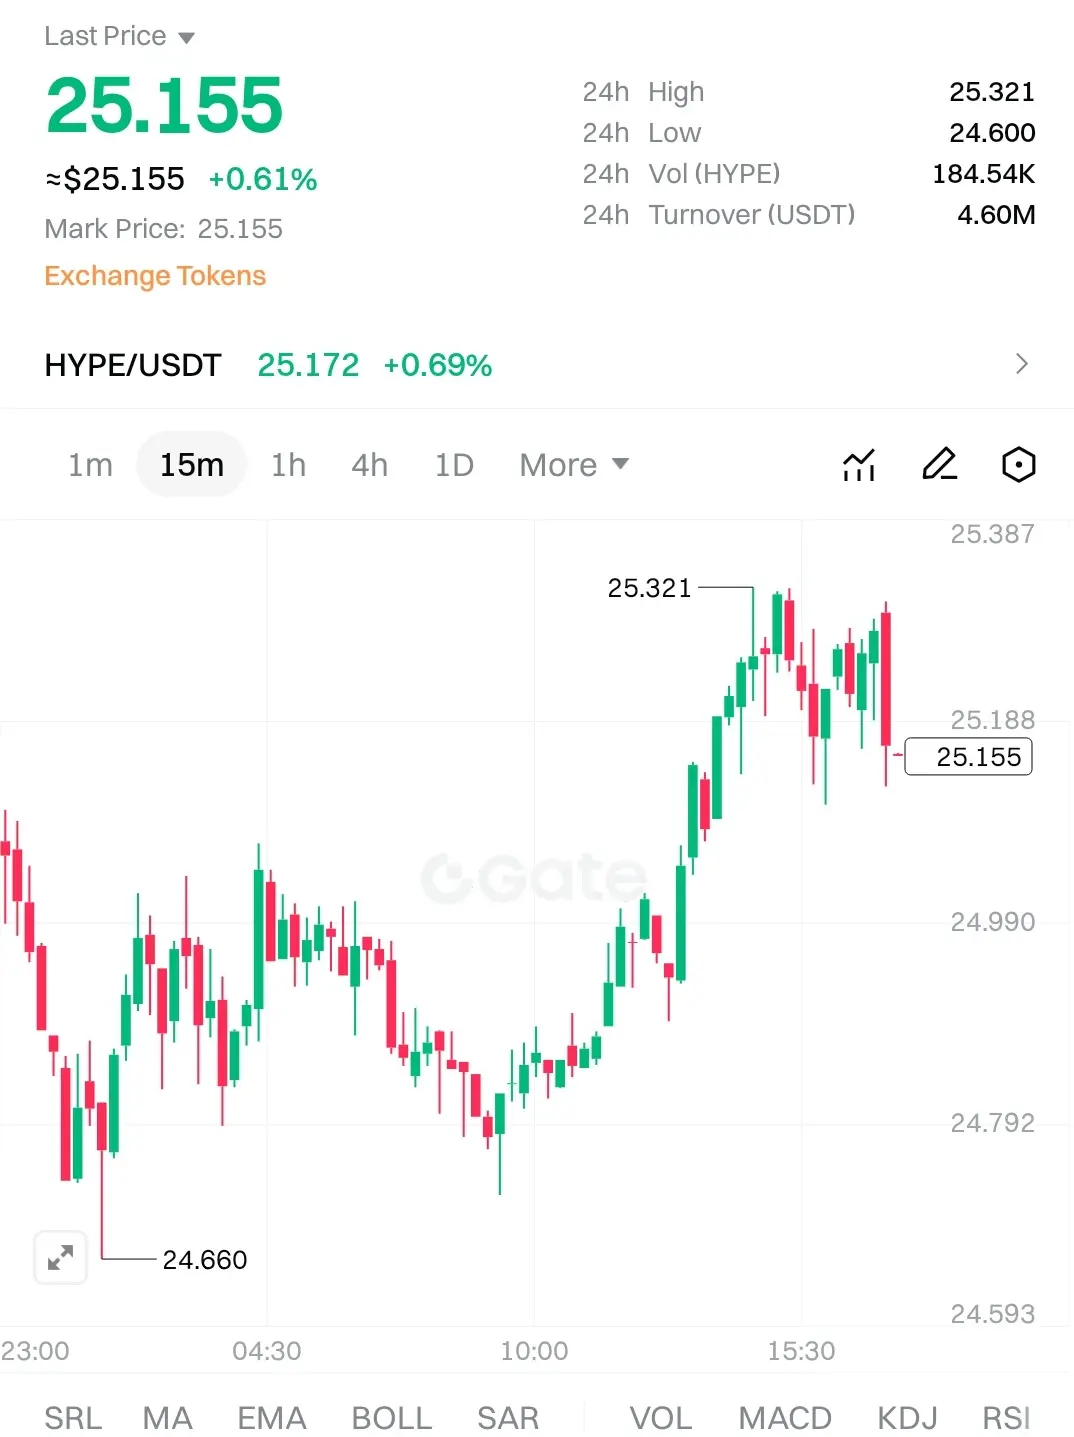
$HYPE /USDT
HYPE pushed up quickly to the $25.60 area, then cooled down with a controlled pullback. Price is now hovering around $24.50–$24.35, a key short-term demand zone showing early signs of absorption. Sellers are present, but momentum is clearly slowing.
As long as $24.35 holds, this looks like consolidation rather than a breakdown. A bounce from here could take price back toward $24.90 first, and if momentum builds, $25.30–$25.60 comes back into play. That zone is strong resistance and will likely decide the next move.
If $24.35 breaks, a deeper sweep could shake out weak hands before
HYPE-3,04%
- Reward
- like
- Comment
- Repost
- Share
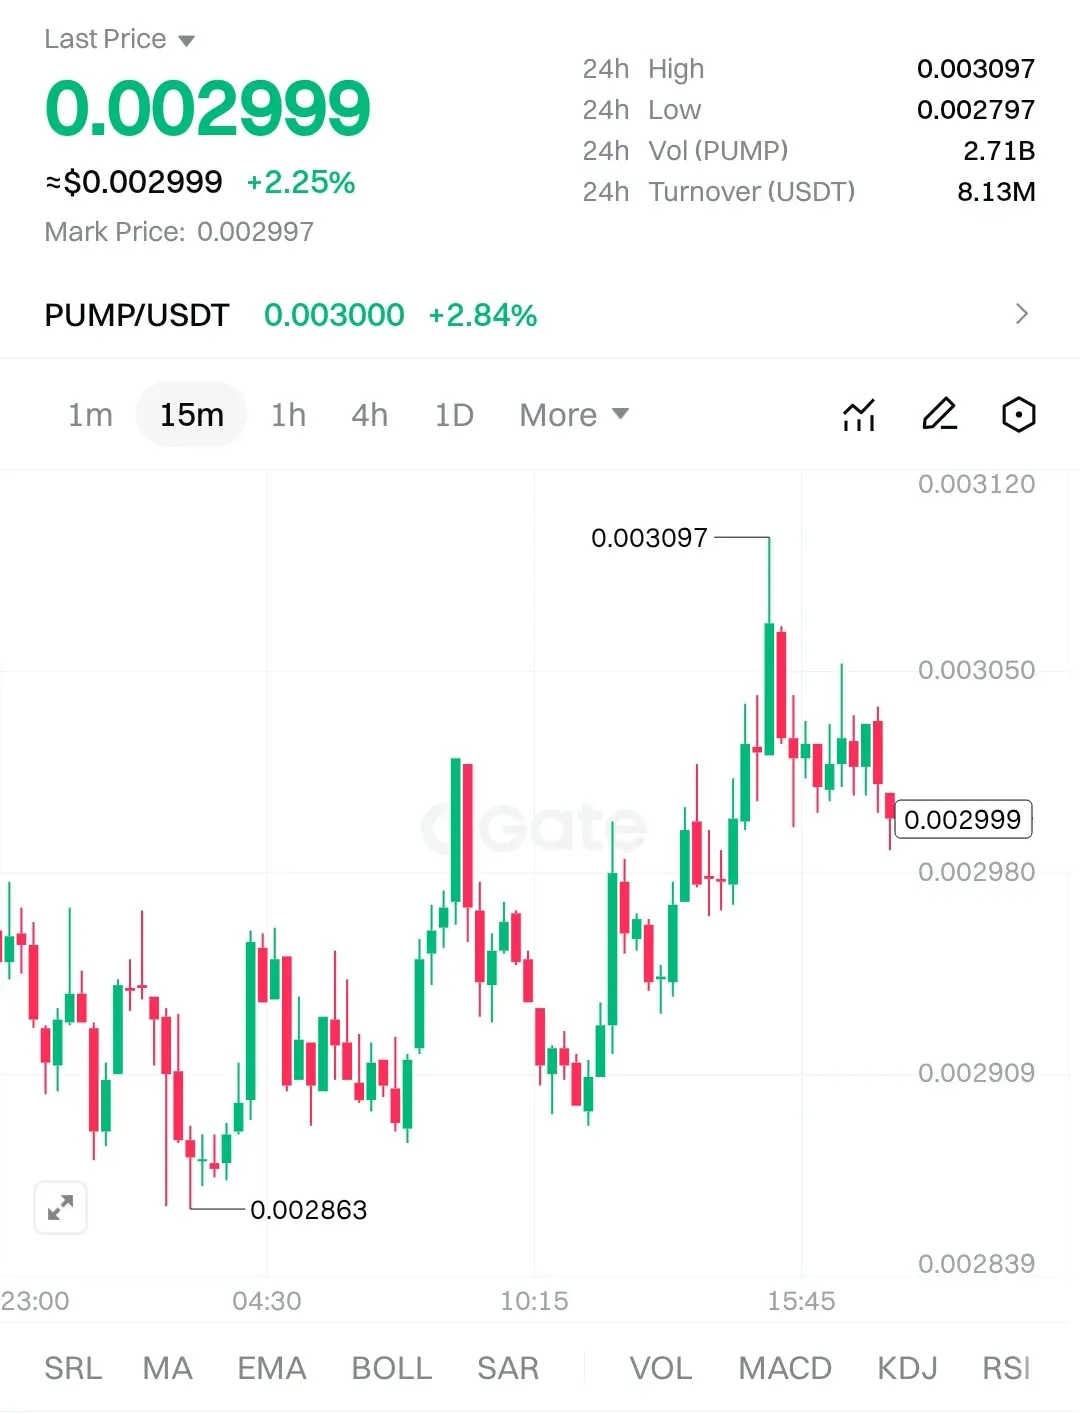
$PUMP /USDT 🚀
Price is pushing strong around $0.00304 after bouncing cleanly from $0.00286. It’s now trading above MA5, MA10, and MA30, showing momentum is shifting bullish and buyers are clearly in control.
As long as $0.00295 holds, the structure looks healthy and the upward move can continue. Immediate resistance is near $0.00304–$0.00306, and a clean break could open the way for a faster climb. Dropping below $0.00290 would weaken the setup, but for now, the trend is clearly favoring upside.
It’s a solid setup to watch and trade carefully.
#CryptoMarketWatch #ChineseMemecoinBoom
PUMP-4,37%
- Reward
- 2
- 1
- Repost
- Share
RjHaroon:
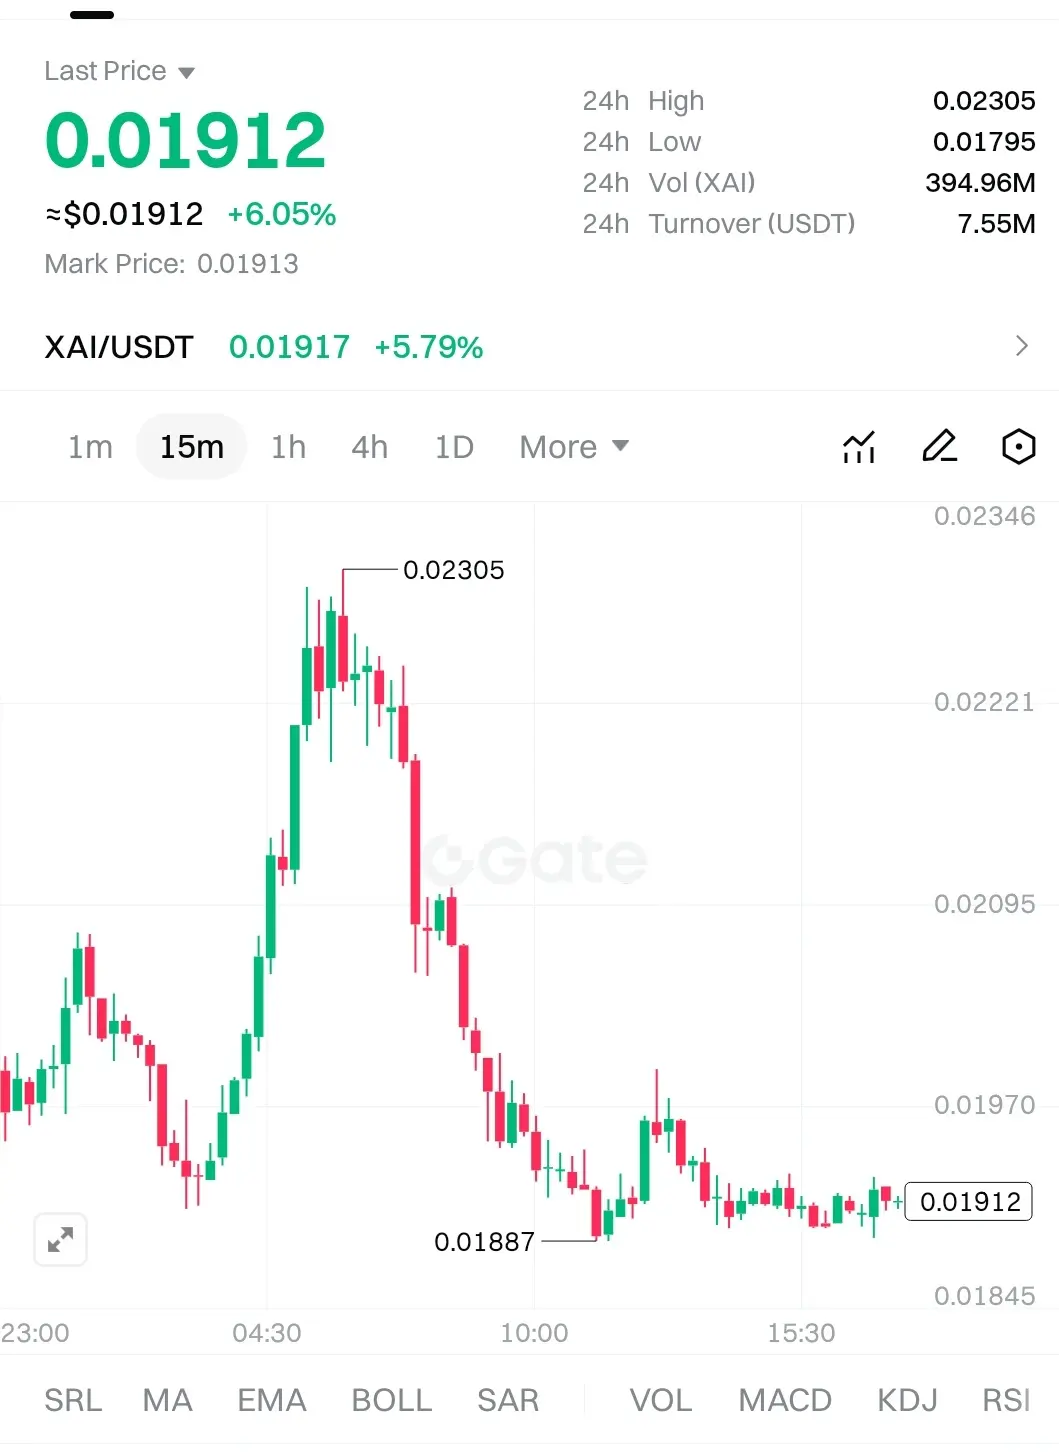
Happy New Year! 🤑$XAG USDT ⚡
Price is finding its footing around $0.01920 after dropping from $0.02457. The reaction near $0.01884 is holding strong, hinting a short-term base might be forming. I’m seeing the MA5 and MA10 starting to turn up, which tells me selling pressure is easing and buyers are slowly coming back in.
If $0.01880 holds, this area could act as a springboard for a bounce. A move above $0.01980–$0.02000 could bring momentum back quickly, while dropping below $0.01880 might slow the recovery.
Volatility is tightening, which usually means a move is ready to launch. It’s an interesting setup to w
- Reward
- like
- Comment
- Repost
- Share
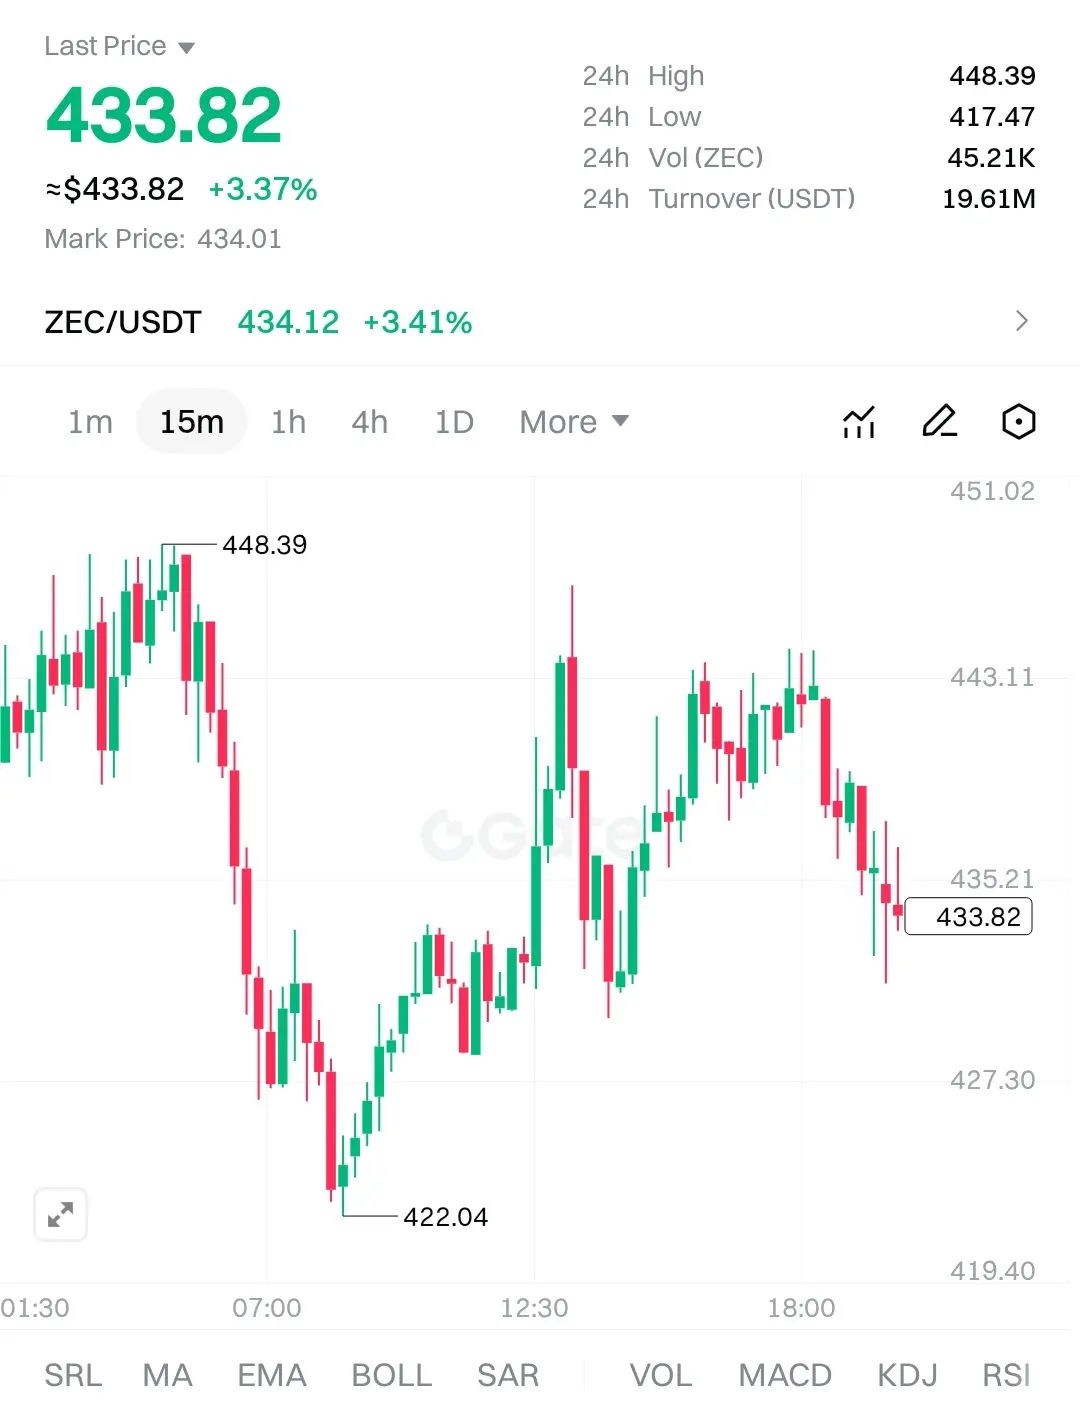
$ZEC just took a pause after its recent push, but it’s holding firm around $390. That zone is acting as a short-term base, giving buyers a chance to regroup.
Selling pressure is easing, and the candles are tightening, showing the market is deciding its next move. If $ZEC can hold this area and climb back above the moving averages, a bounce toward $410–$420 is very possible.
On the flip side, dropping below $390 would open the door for another dip, so this level is key to watch. Right now, patience pays—this is a setup where a clear move could happen fast once the market chooses a direction. $
ZEC-5,63%
- Reward
- like
- Comment
- Repost
- Share
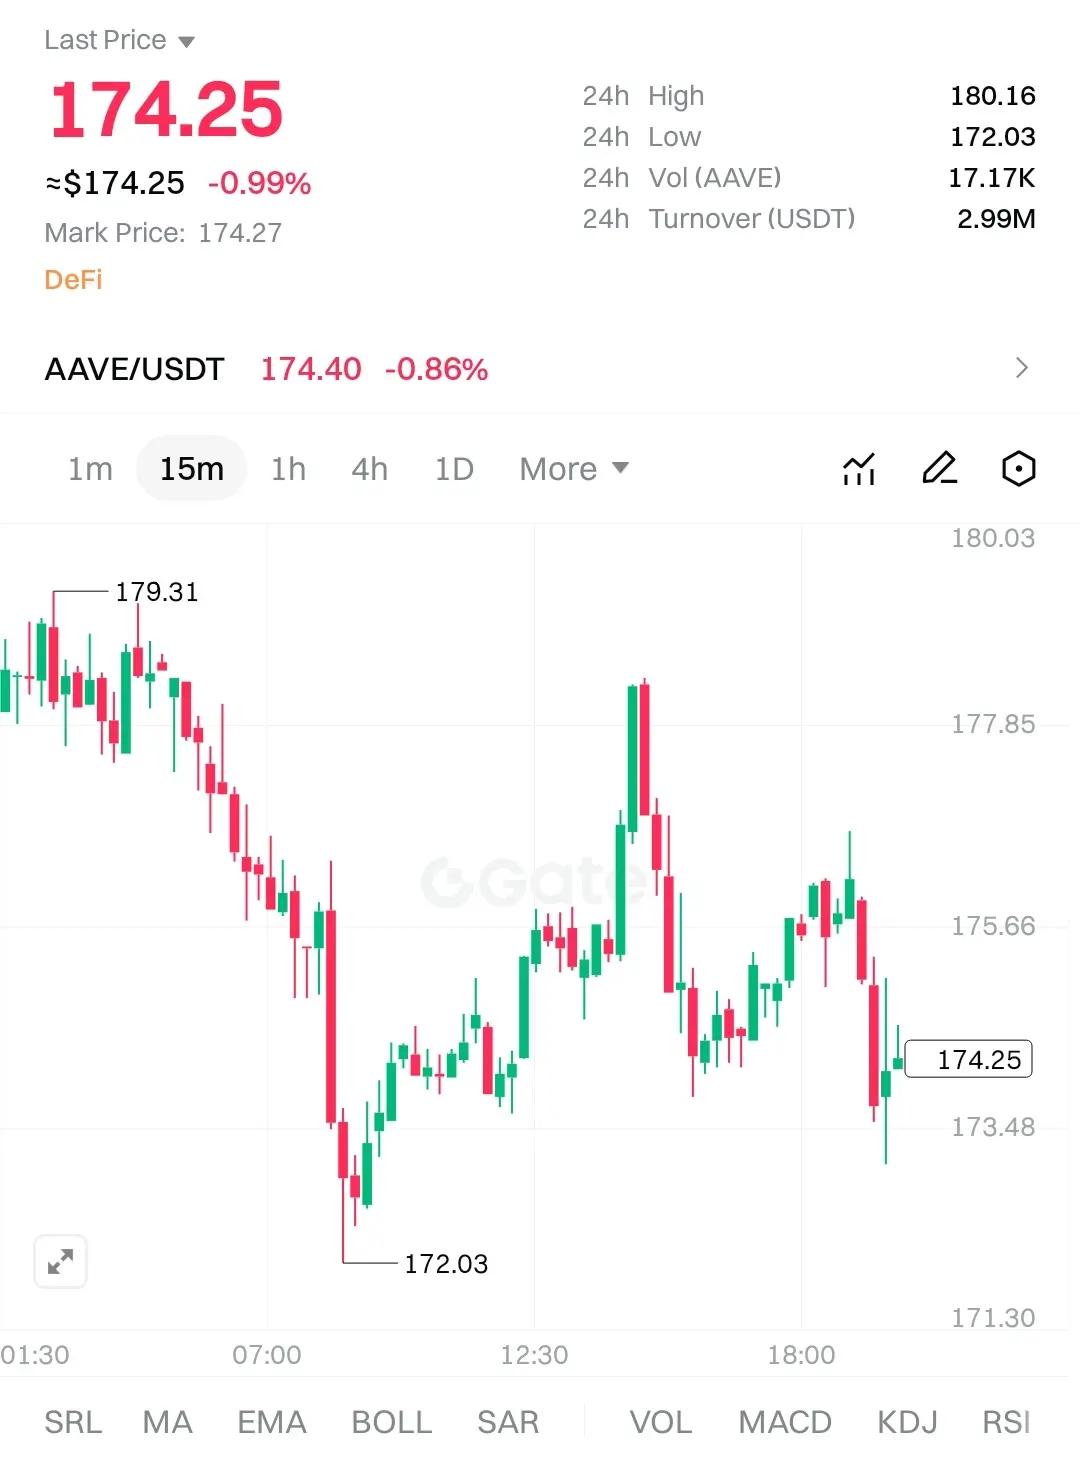
$AAVE just showed some real strength.
After touching the $160 area, price bounced hard and is now trading above all the key moving averages. Buyers didn’t just step in—they came with momentum. That shift flipped the short-term structure bullish.
Right now, $166–$167 is the line to watch. As long as it holds, the path toward $171–$173 looks clear. Even if there’s a small pullback into that support, it’s healthy—buyers are likely to defend it. The trend is clearly shifting upward, and the market is showing signs of confidence.
This is the kind of setup where dips become opportunities, and each
AAVE-2,46%
- Reward
- like
- Comment
- Repost
- Share
Trending Topics
View More354.71K Popularity
115.9K Popularity
427.88K Popularity
11.4K Popularity
128.61K Popularity
Pin