AI Token (AI) has collectively adjusted along with Bitcoin (BTC) and the overall cryptocurrency market for three consecutive days as geopolitical tensions escalate around the US’s intention to acquire Greenland. However, some representatives within the AI group are showing signs of resilience, attempting to establish support zones and aiming for a scenario to retest key resistance levels.
ICP Faces Pressure Around 20-Day and 50-Day EMA
Internet Computer (ICP) is currently struggling to defend a critical support zone, where the 20-day and 50-day exponential moving averages (EMA) converge. Selling pressure increased after the price was strongly rejected at the resistance zone around $4.41 — an area that becomes even more “rigid” when it coincides with the 200-day EMA.
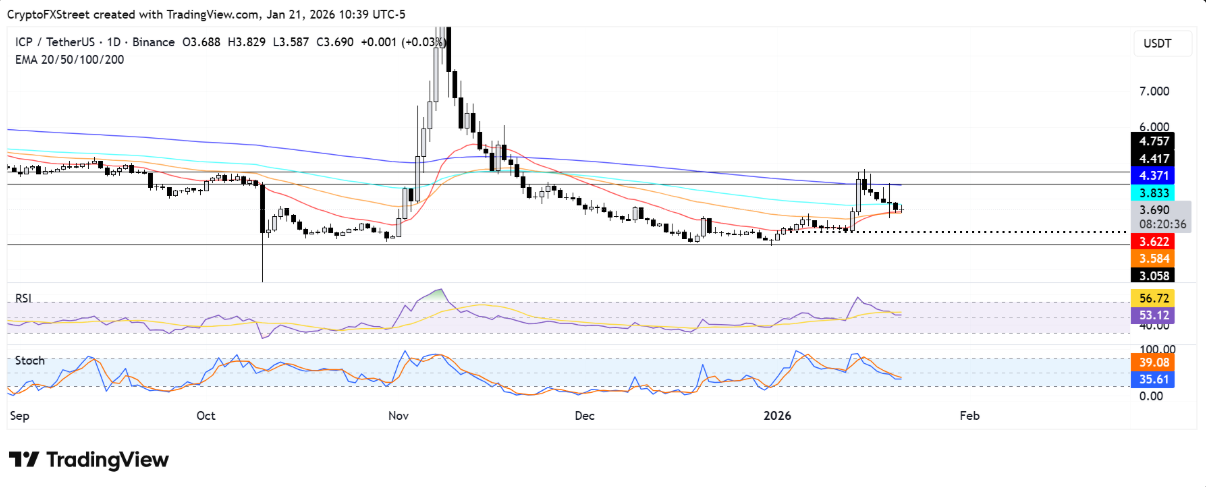 Daily ICP/USDT Chart | Source: TradingViewIn a negative scenario, if ICP loses the EMA 20 and EMA 50 support zones, the price is likely to retreat to test the psychological level of $3.0. Further down, the $2.70 zone could become the “last shield,” acting as a buffer to absorb selling pressure if the downtrend continues strongly.
On the other hand, the recovery outlook is only truly supported when ICP maintains a steady upward momentum above the 100-day EMA, opening up the possibility of returning to challenge the $4.41 resistance zone.
In terms of momentum, the RSI indicator is oscillating around the neutral threshold, while the Stochastic Oscillator remains below the midline — signals that the upward momentum is weakening and the market still lacks clear breakout strength.
Bittensor Holds Support at $230, Aiming for Downtrend Resistance
Bittensor (TAO) is striving to defend an important support zone around $230 after the price fell below both the 20-day and 50-day EMAs. Over the past week, this AI token has maintained a clear downtrend, originating from failure to approach the $305 resistance zone — an area coinciding with the 100-day EMA and acting as a “wall” hindering upward movement.
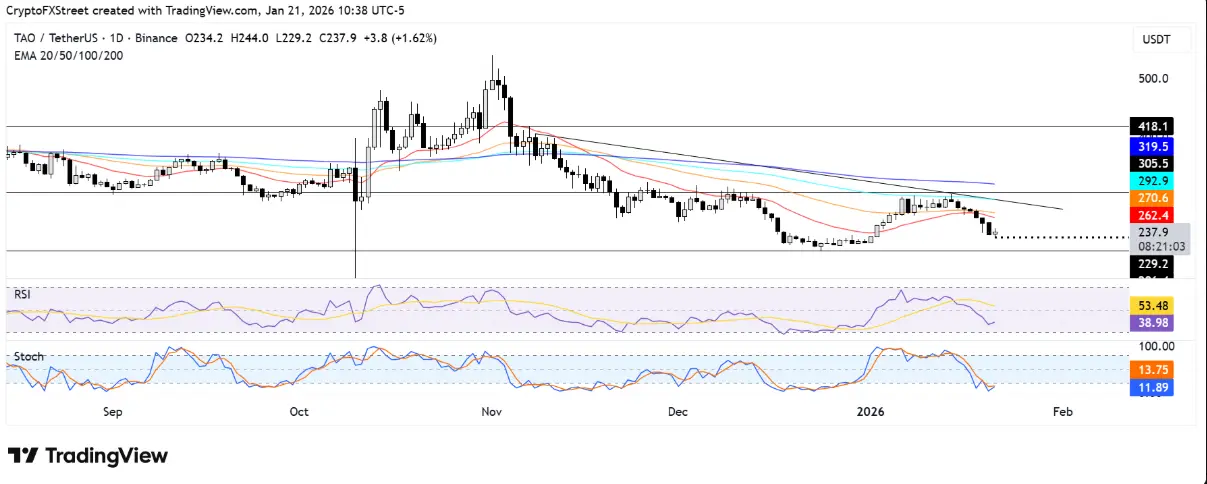 TAO/USDT Daily Chart | Source: TradingViewIn a positive scenario, if TAO maintains the $230 level and quickly recovers the 50-day EMA, the price could open up opportunities to test the downtrend line formed since November 8. Conversely, losing this support zone would increase selling pressure, pushing TAO back to a lower support area around $206.
Regarding technical indicators, RSI is currently below the neutral threshold, reflecting weakening momentum. Meanwhile, the Stochastic Oscillator has entered the oversold zone — a factor that could trigger a short-term technical rebound if buying interest returns.
###Render Bounces at $1.86, Testing 100-Day EMA
Render (RENDER) is in the process of testing the 100-day EMA after bouncing from the support zone at $1.86 — an area that coincides with the 50-day EMA, temporarily halting the previous decline.
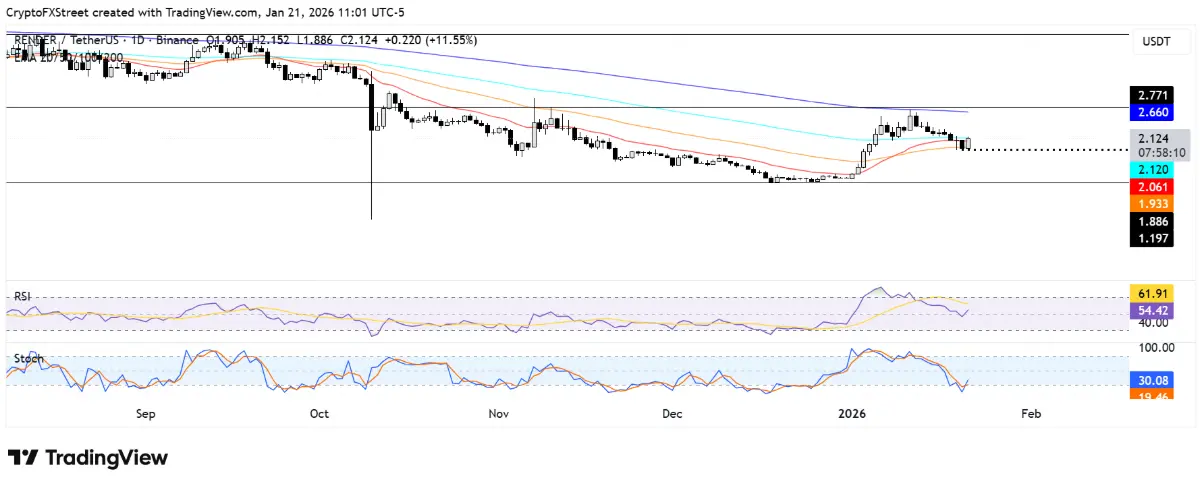 Daily RENDER/USDT Chart | Source: TradingViewIn a positive scenario, if the price can break through and sustain above the 100-day EMA, RENDER is likely to target the resistance zone at $2.77, located just above the 200-day EMA. Conversely, if the $1.86 support level is broken, selling pressure could push the price down to around $1.19.
Regarding momentum, the RSI indicator has recovered from the neutral zone, while the Stochastic Oscillator has exited the oversold region, indicating weakening selling pressure and signs of a slowdown in the downtrend.
Disclaimer: The information on this page may come from third parties and does not represent the views or opinions of Gate. The content displayed on this page is for reference only and does not constitute any financial, investment, or legal advice. Gate does not guarantee the accuracy or completeness of the information and shall not be liable for any losses arising from the use of this information. Virtual asset investments carry high risks and are subject to significant price volatility. You may lose all of your invested principal. Please fully understand the relevant risks and make prudent decisions based on your own financial situation and risk tolerance. For details, please refer to
Disclaimer.
Related Articles
BTC 15-minute drop of 0.51%: short-term capital outflow and macro volatility converging to trigger a pullback
Between 2026-04-07 14:00 and 2026-04-07 14:15 (UTC), the BTC price fluctuated within the range of 67801.3 - 68256.1 USDT. The candlestick chart recorded a -0.51% return, with an amplitude of 0.67%. Short-term volatility intensified, and market attention increased significantly. Overall liquidity was still within the normal range, but showed marginal changes.
The main drivers of this unusual move are the combined effect of short-term capital outflows and the simultaneous rise in net inflows to exchanges. Short-term holders take profit or cut losses at market volatility nodes, pushing prices lower. Spot
GateNews3m ago
'A whole civilization will die': Crypto markets under pressure as Trump ups rhetoric towards Iran
Bitcoin has fallen to around $68,000 after hitting over $70,000, coinciding with Trump's Iran deadline. U.S. stock futures also declined, while oil prices rose. Vance's comments tempered market reactions, stating military goals in Iran were met.
CoinDesk55m ago
Analyst Says Five Years of Nothing for Ethereum and Altcoin Will Finally End Soon
Analyst says five years of nothing for Ethereum and altcoins will end soon.
This means the altseason peak phase is nearing.
How far can the price of ETH pump this year?
Expectations for altseason to play out this year remain strong despite the many calls for the bear market to have
CryptoNewsLand2h ago
Onchain Perp DEX Volume Falls for Fifth Straight Month as March Drops to $699B
Onchain perpetual futures trading has sharply declined for five consecutive months, with March 2026 volume dropping to $699 billion from a peak of $1.36 trillion in October 2025. Hyperliquid dominates the market, capturing 34% of recent trading activity.
CryptoNewsFlash2h ago
Bitcoin Tests Long-Term Holder Resilience Near Key Support Levels
Bitcoin is testing a crucial support level at $67,675, just $1,000 away, amidst a -44.8% drawdown. The outcome may dictate future price movements, with a potential correction to $54,000-$58,000 if breached. Historical patterns reveal Bitcoin's cyclical volatility.
BlockChainReporter2h ago
Bitcoin is negatively correlated with the global easing breadth index; this week, ETFs recorded their largest net inflow since February
The negative correlation between Bitcoin and global central bank monetary policy suggests that institutional capital has already positioned itself ahead of a potential easing cycle. In the recent spot ETF net inflows have hit a new high, but the market remains choppy and unstable, with weak demand. Corporate allocation has slowed, volatility in the options market has increased, and traders are more inclined to add downside protection.
GateNews2h ago
