
**Date: **Wed, Jan 07, 2026 | 06:20 AM GMT
The broader cryptocurrency market continues to show strong New Year momentum, with Bitcoin (BTC) up around 4% and Ethereum (ETH) gaining over 9% on a weekly basis. This improving sentiment is gradually spilling over into major altcoins — including the DePIN-focused token Akash Network (AKT).
AKT has already posted an impressive 20% weekly gain. While this short-term strength has caught traders’ attention, the more important development is unfolding on the higher-timeframe chart. Recent price action suggests a meaningful shift in market structure, hinting that AKT may be transitioning out of a prolonged corrective phase and into the early stages of a bullish continuation.
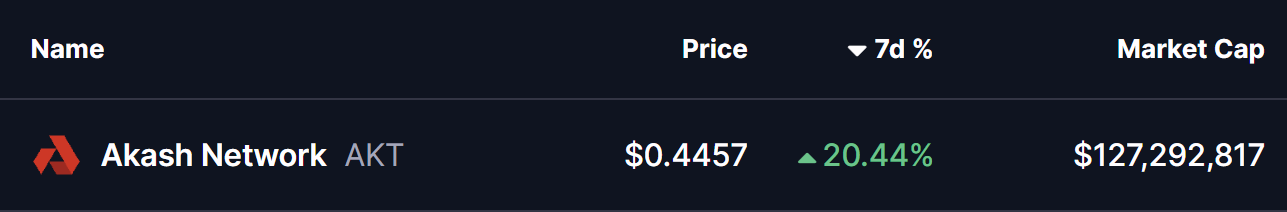
Source: Coinmarketcap
Falling Wedge and Rounding Bottom in Play
On the daily chart, AKT has been trading within a broader falling wedge — a structure that often precedes bullish reversals as selling pressure gradually weakens. Within this larger wedge, price action is also shaping a developing rounding bottom pattern, reflecting steady accumulation and seller exhaustion.
The formation began after AKT faced strong rejection near the $0.5441 resistance zone in late November. That rejection triggered a sharp sell-off, pushing price lower toward the $0.3465 region. However, bears failed to extend losses beyond this area. Instead, demand stepped in, downside momentum slowed, and price began to stabilize.
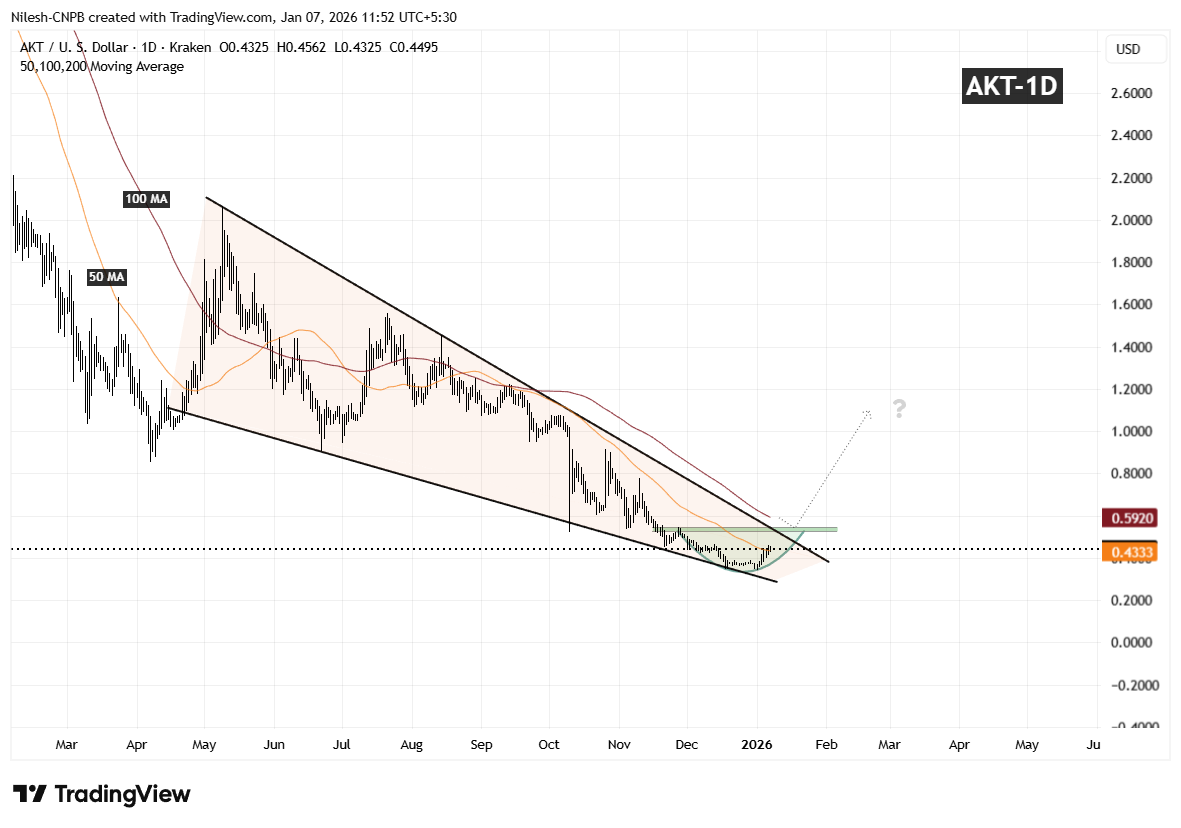
Akash Network (AKT) Daily Chart/Coinsprobe (Source: Tradingview)
Over the following weeks, volatility compressed and AKT started to curl higher in a smooth, rounded fashion — closely matching the textbook behavior of a rounding bottom. Importantly, the recent rebound has pushed price back above the 50-day moving average around $0.4333, a level that had previously acted as resistance and is now beginning to flip into support.
What’s Next for AKT?
If AKT can continue to hold above the 50-day moving average, this area may act as a solid base for further upside attempts. From here, attention shifts toward the descending resistance trendline of the falling wedge, which aligns closely with the $0.5441 resistance zone.
A clean and decisive breakout above this confluence area, followed by sustained acceptance, would confirm a broader bullish expansion phase and mark a clear trend reversal from the prior downtrend. Such a move would likely attract renewed momentum participation as the market recognizes the structural shift.
Until that breakout occurs, the pattern remains in development. Short-term consolidation or shallow pullbacks are still possible as price digests recent gains. However, as long as AKT continues to print higher lows above the established base, the broader technical structure remains constructive.
Overall, the chart suggests AKT is approaching a critical inflection point — one that could determine whether this recovery evolves into a sustained bullish trend as 2026 progresses.
Disclaimer: The views and analysis presented in this article are for informational purposes only and reflect the author’s perspective, not financial advice. Technical patterns and indicators discussed are subject to market volatility and may or may not yield the anticipated results. Investors are advised to exercise caution, conduct independent research, and make decisions aligned with their individual risk tolerance.
About Author: Nilesh Hembade is the Founder and Lead Author of Coinsprobe, with over 5 years of experience in the cryptocurrency and blockchain industry. Since launching Coinsprobe in 2023, he has been providing daily, research-driven insights through in-depth market analysis, on-chain data, and technical research.
Disclaimer: The information on this page may come from third parties and does not represent the views or opinions of Gate. The content displayed on this page is for reference only and does not constitute any financial, investment, or legal advice. Gate does not guarantee the accuracy or completeness of the information and shall not be liable for any losses arising from the use of this information. Virtual asset investments carry high risks and are subject to significant price volatility. You may lose all of your invested principal. Please fully understand the relevant risks and make prudent decisions based on your own financial situation and risk tolerance. For details, please refer to
Disclaimer.
Related Articles
Iran Strikes Saudi Jubail: Tensions in the Strait of Hormuz Trigger a Bitcoin Drop and a Surge in Oil Prices
Iran launched a missile and drone attack on Saudi Arabia’s Jubail on April 7, triggering a large fire and further escalating tensions in the Middle East. Iran rejected the U.S. peace plan and put forward a 10-point counterproposal, indicating that it is seeking to consolidate its advantage in negotiations. The market response was clear, with Bitcoin and precious metals prices fluctuating; the situation ahead will affect global energy and financial markets.
GateNews5m ago
Curve DAO approaches 0.20 USD key support: Can CRV stop the decline and rebound?
The Curve DAO (CRV) price is approaching the $0.20 critical support level, and the short-term trend is facing a choice. Although there are slight signs of stabilization, the overall downward momentum has not been resolved. Technical and fundamental risks are prompting traders to watch whether $0.20 can hold.
GateNews21m ago
Worldcoin is nearing its all-time low: the $326 million buy order failed, and $0.20 is the next target for WLD
Worldcoin (WLD) price continues to hover near its historical lows, currently at $0.2482, and the near-term trend remains weak. Despite large inflows of institutional capital such as Eightco Holdings, there are still no signs of a rebound in the market—if anything, it has intensified supply pressure. On-chain data supports the risk of selling off; once the key support level of $0.2455 is broken, it could quickly drop to $0.20. Overall, WLD faces structural pressure, and the market is focused on whether it can break through the historical low.
GateNews22m ago
Polymarket: Iran ceasefire probability is only 3%, and the surge in oil prices is hitting Bitcoin’s price trend
The expected shift around Iran ceasefire talks is toward pessimism, and the trading market shows that the ceasefire success rate set by Trump is only 3%. Iran rejected a short-term ceasefire proposal and put forward long-term political and economic conditions, further compressing the room for negotiations. Energy markets are strengthening in expectation, and the probability that WTI crude for April, which hit $120, rises to 77%. Crypto assets such as Bitcoin are under pressure during the phase when risk appetite declines, with capital flowing into traditional safe-haven assets.
GateNews28m ago
Grayscale’s New Bets: 43% of Its AI Fund Into One Coin (It’s Not NEAR or RENDER)
Grayscale increased its investment in TAO within its AI-focused crypto fund from 31% to over 43%, highlighting strong confidence in the project amid a selective approach to other AI tokens. This move may influence market sentiment around TAO.
CaptainAltcoin43m ago
Bitcoin Drops Below $69k: Trump’s Final Ultimatum to Iran Triggers Risk-Off Selling
Bitcoin fell to $685,000 on April 7, down about 2% for the day. Driven by concerns over the Middle East situation, risk-off sentiment has increased. With the market under pressure and international oil prices rising, the crypto market has faced headwinds, and investors lack confidence in a Bitcoin rebound. In the short term, macro events will continue to affect Bitcoin’s price action.
GateNews1h ago
