Date: Thu, Dec 18, 2025 | 08:50 AM GMT
The broader cryptocurrency market has been experiencing choppy price action over the past several weeks, a phase that began after the sharp sell-off on October 10. That correction dragged** Ethereum (ETH) **down by nearly 22% over the last 60 days, keeping sustained pressure on major altcoins, including Polygon (POL).
POL has dropped more than 10% over the past week and is now down over 43% across the last 60 days. While the short-term trend remains clearly bearish, the higher-timeframe chart is beginning to reveal a technical structure that could be setting the stage for a potential rebound if key levels are reclaimed.
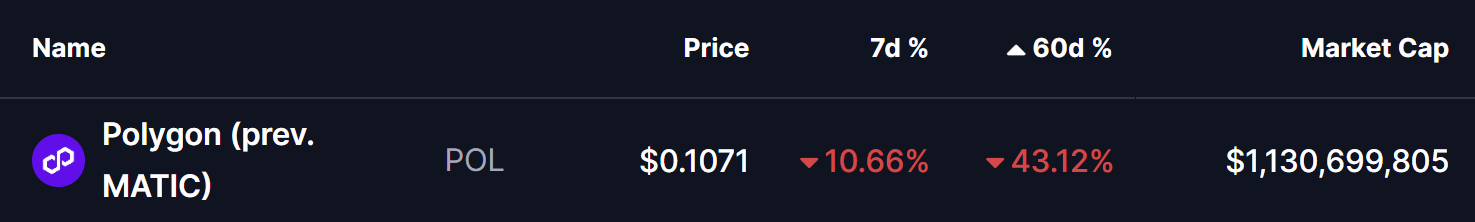
Source: Coinmarketcap
Power of 3 Pattern in Play?
On the weekly chart, POL appears to be forming a classic Power of 3 structure, a pattern often associated with market cycle lows and trend transitions. This setup typically unfolds in three phases — accumulation, manipulation, and expansion — with the most volatile move emerging once the final stage begins.
Accumulation Phase
Earlier in the year, POL spent an extended period consolidating within a well-defined range, capped by resistance near the $0.27 region and supported around the $0.15 zone. This sideways movement reflected an accumulation phase, where volatility compressed and price action became increasingly muted. Such conditions often suggest quiet positioning by larger market participants while broader interest fades and sentiment turns neutral to bearish.
This range-bound behavior laid the groundwork for the next phase of the structure, as liquidity built up on both sides of the market.
Manipulation Phase
During the latest market-wide downturn, POL broke decisively below the $0.15 accumulation support, sliding to a recent low near $0.107. This sharp breakdown, highlighted by the red-shaded area on the chart, aligns closely with the manipulation phase of the Power of 3 pattern. Moves like this are typically designed to trigger stop losses, force capitulation among weaker holders, and push sentiment to pessimistic extremes.
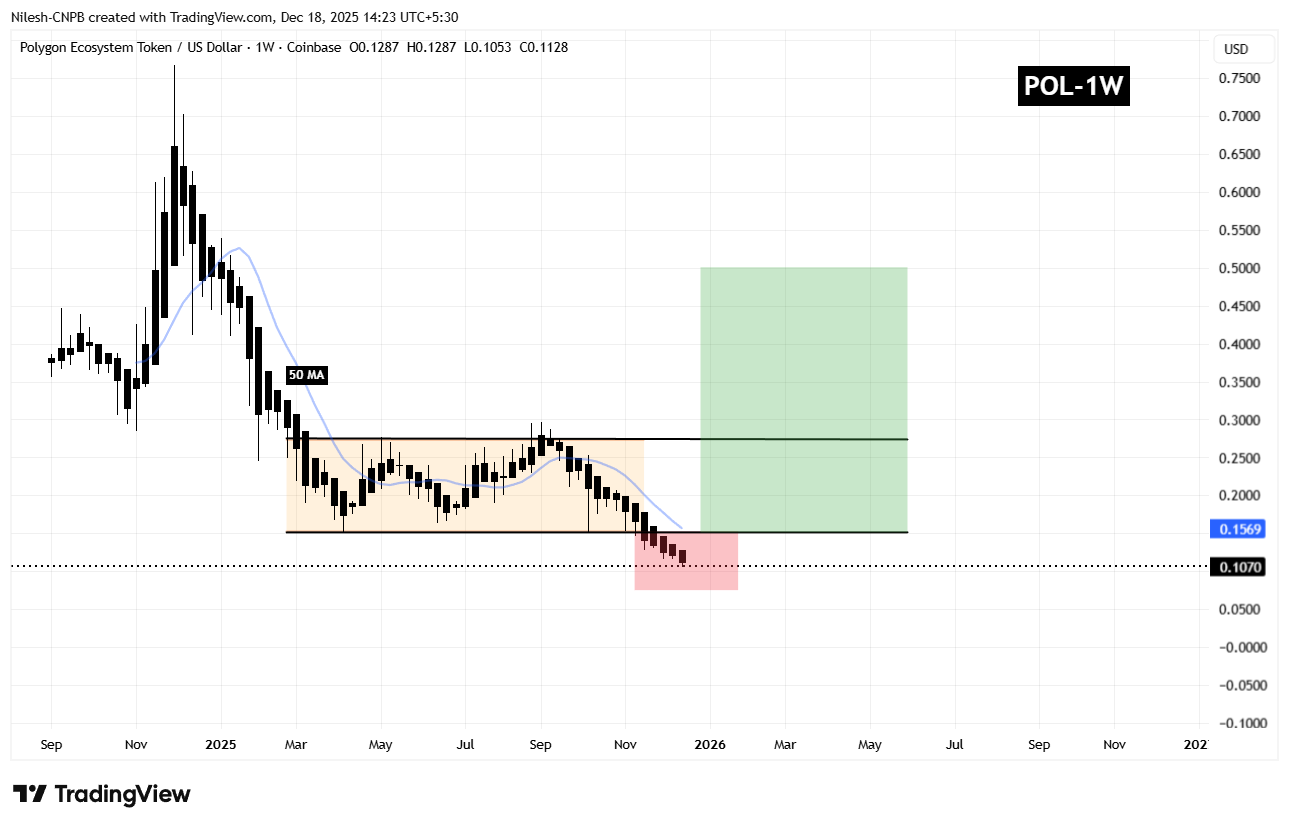
Polygon (POL) Weekly Chart/Coinsprobe (Source: Tradingview)
Notably, the selling pressure has started to lose momentum near this lower zone. Candles are compressing, and downside follow-through appears limited, suggesting that aggressive distribution may be nearing exhaustion.
What’s Next for POL?
At present, POL remains within this manipulation zone, indicating that the market is still probing for direction before committing to a larger move. A brief period of consolidation around current levels would not be unusual, as buyers and sellers continue to battle for control.
For the bullish scenario to gain traction, POL needs to reclaim the $0.15 support zone and move back above the 50-week moving average near $0.1569. A successful recovery above these levels would signal a transition into the expansion phase of the Power of 3 structure, where upside momentum typically accelerates quickly.
If that breakout materializes, the chart projection points toward a potential move into the $0.48–$0.50 region over the coming months, an area that aligns with prior structural resistance.
However, this setup remains conditional. As long as POL continues to trade below $0.15, downside risks cannot be ruled out, and the market remains vulnerable to further volatility. Holding current lows and reclaiming key resistance levels will be critical for bulls to validate the bullish reversal narrative.
Disclaimer: The views and analysis presented in this article are for informational purposes only and reflect the author’s perspective, not financial advice. Technical patterns and indicators discussed are subject to market volatility and may or may not yield the anticipated results. Investors are advised to exercise caution, conduct independent research, and make decisions aligned with their individual risk tolerance.
Disclaimer: The information on this page may come from third parties and does not represent the views or opinions of Gate. The content displayed on this page is for reference only and does not constitute any financial, investment, or legal advice. Gate does not guarantee the accuracy or completeness of the information and shall not be liable for any losses arising from the use of this information. Virtual asset investments carry high risks and are subject to significant price volatility. You may lose all of your invested principal. Please fully understand the relevant risks and make prudent decisions based on your own financial situation and risk tolerance. For details, please refer to
Disclaimer.
Related Articles
Curve DAO approaches 0.20 USD key support: Can CRV stop the decline and rebound?
The Curve DAO (CRV) price is approaching the $0.20 critical support level, and the short-term trend is facing a choice. Although there are slight signs of stabilization, the overall downward momentum has not been resolved. Technical and fundamental risks are prompting traders to watch whether $0.20 can hold.
GateNews8m ago
Worldcoin is nearing its all-time low: the $326 million buy order failed, and $0.20 is the next target for WLD
Worldcoin (WLD) price continues to hover near its historical lows, currently at $0.2482, and the near-term trend remains weak. Despite large inflows of institutional capital such as Eightco Holdings, there are still no signs of a rebound in the market—if anything, it has intensified supply pressure. On-chain data supports the risk of selling off; once the key support level of $0.2455 is broken, it could quickly drop to $0.20. Overall, WLD faces structural pressure, and the market is focused on whether it can break through the historical low.
GateNews9m ago
Polymarket: Iran ceasefire probability is only 3%, and the surge in oil prices is hitting Bitcoin’s price trend
The expected shift around Iran ceasefire talks is toward pessimism, and the trading market shows that the ceasefire success rate set by Trump is only 3%. Iran rejected a short-term ceasefire proposal and put forward long-term political and economic conditions, further compressing the room for negotiations. Energy markets are strengthening in expectation, and the probability that WTI crude for April, which hit $120, rises to 77%. Crypto assets such as Bitcoin are under pressure during the phase when risk appetite declines, with capital flowing into traditional safe-haven assets.
GateNews16m ago
Grayscale’s New Bets: 43% of Its AI Fund Into One Coin (It’s Not NEAR or RENDER)
Grayscale increased its investment in TAO within its AI-focused crypto fund from 31% to over 43%, highlighting strong confidence in the project amid a selective approach to other AI tokens. This move may influence market sentiment around TAO.
CaptainAltcoin30m ago
Bitcoin Drops Below $69k: Trump’s Final Ultimatum to Iran Triggers Risk-Off Selling
Bitcoin fell to $685,000 on April 7, down about 2% for the day. Driven by concerns over the Middle East situation, risk-off sentiment has increased. With the market under pressure and international oil prices rising, the crypto market has faced headwinds, and investors lack confidence in a Bitcoin rebound. In the short term, macro events will continue to affect Bitcoin’s price action.
GateNews54m ago
AAVE breaks below the $100 support: DeFi sector selloff intensifies, and $80 may become the key line of defense
The DeFi market continues to face persistent pressure. On April 6, AAVE fell sharply to $84, and the current price is trading in a range around $94. Technical indicators show that bearish signals are dominant, while the fundamentals bring uncertainty due to the end of a partnership. In the short term, watch the $92 support level; $100 is a key reversal signal. The overall trend is influenced by market sentiment, so the probability of a rebound is relatively low.
GateNews57m ago
