CoinDesk senior analyst James Van Straten points out that Bitcoin has experienced the longest miner capitulation in history. As the Hash Ribbon approaches a golden cross, multiple indicators suggest the market has entered a deep value zone, and the darkest decline may be over.
(Background: Michael Saylor: Bitcoin’s 45% retracement is like Apple’s “Valley of Despair”)
(Additional context: Female investor Cathie Wood: Bitcoin is “undoubtedly” superior to gold and has more structural advantages in the modern financial system)
After a three-month period of volatility and decline, Bitcoin (BTC) is showing key reversal signals. According to data from on-chain analytics firm Glassnode, cited by CoinDesk senior analyst James Van Straten, the Hash Ribbon indicator is recovering, indicating that the longest miner capitulation phase since November last year may be ending. Historical data shows that such signals often precede market bottoms.
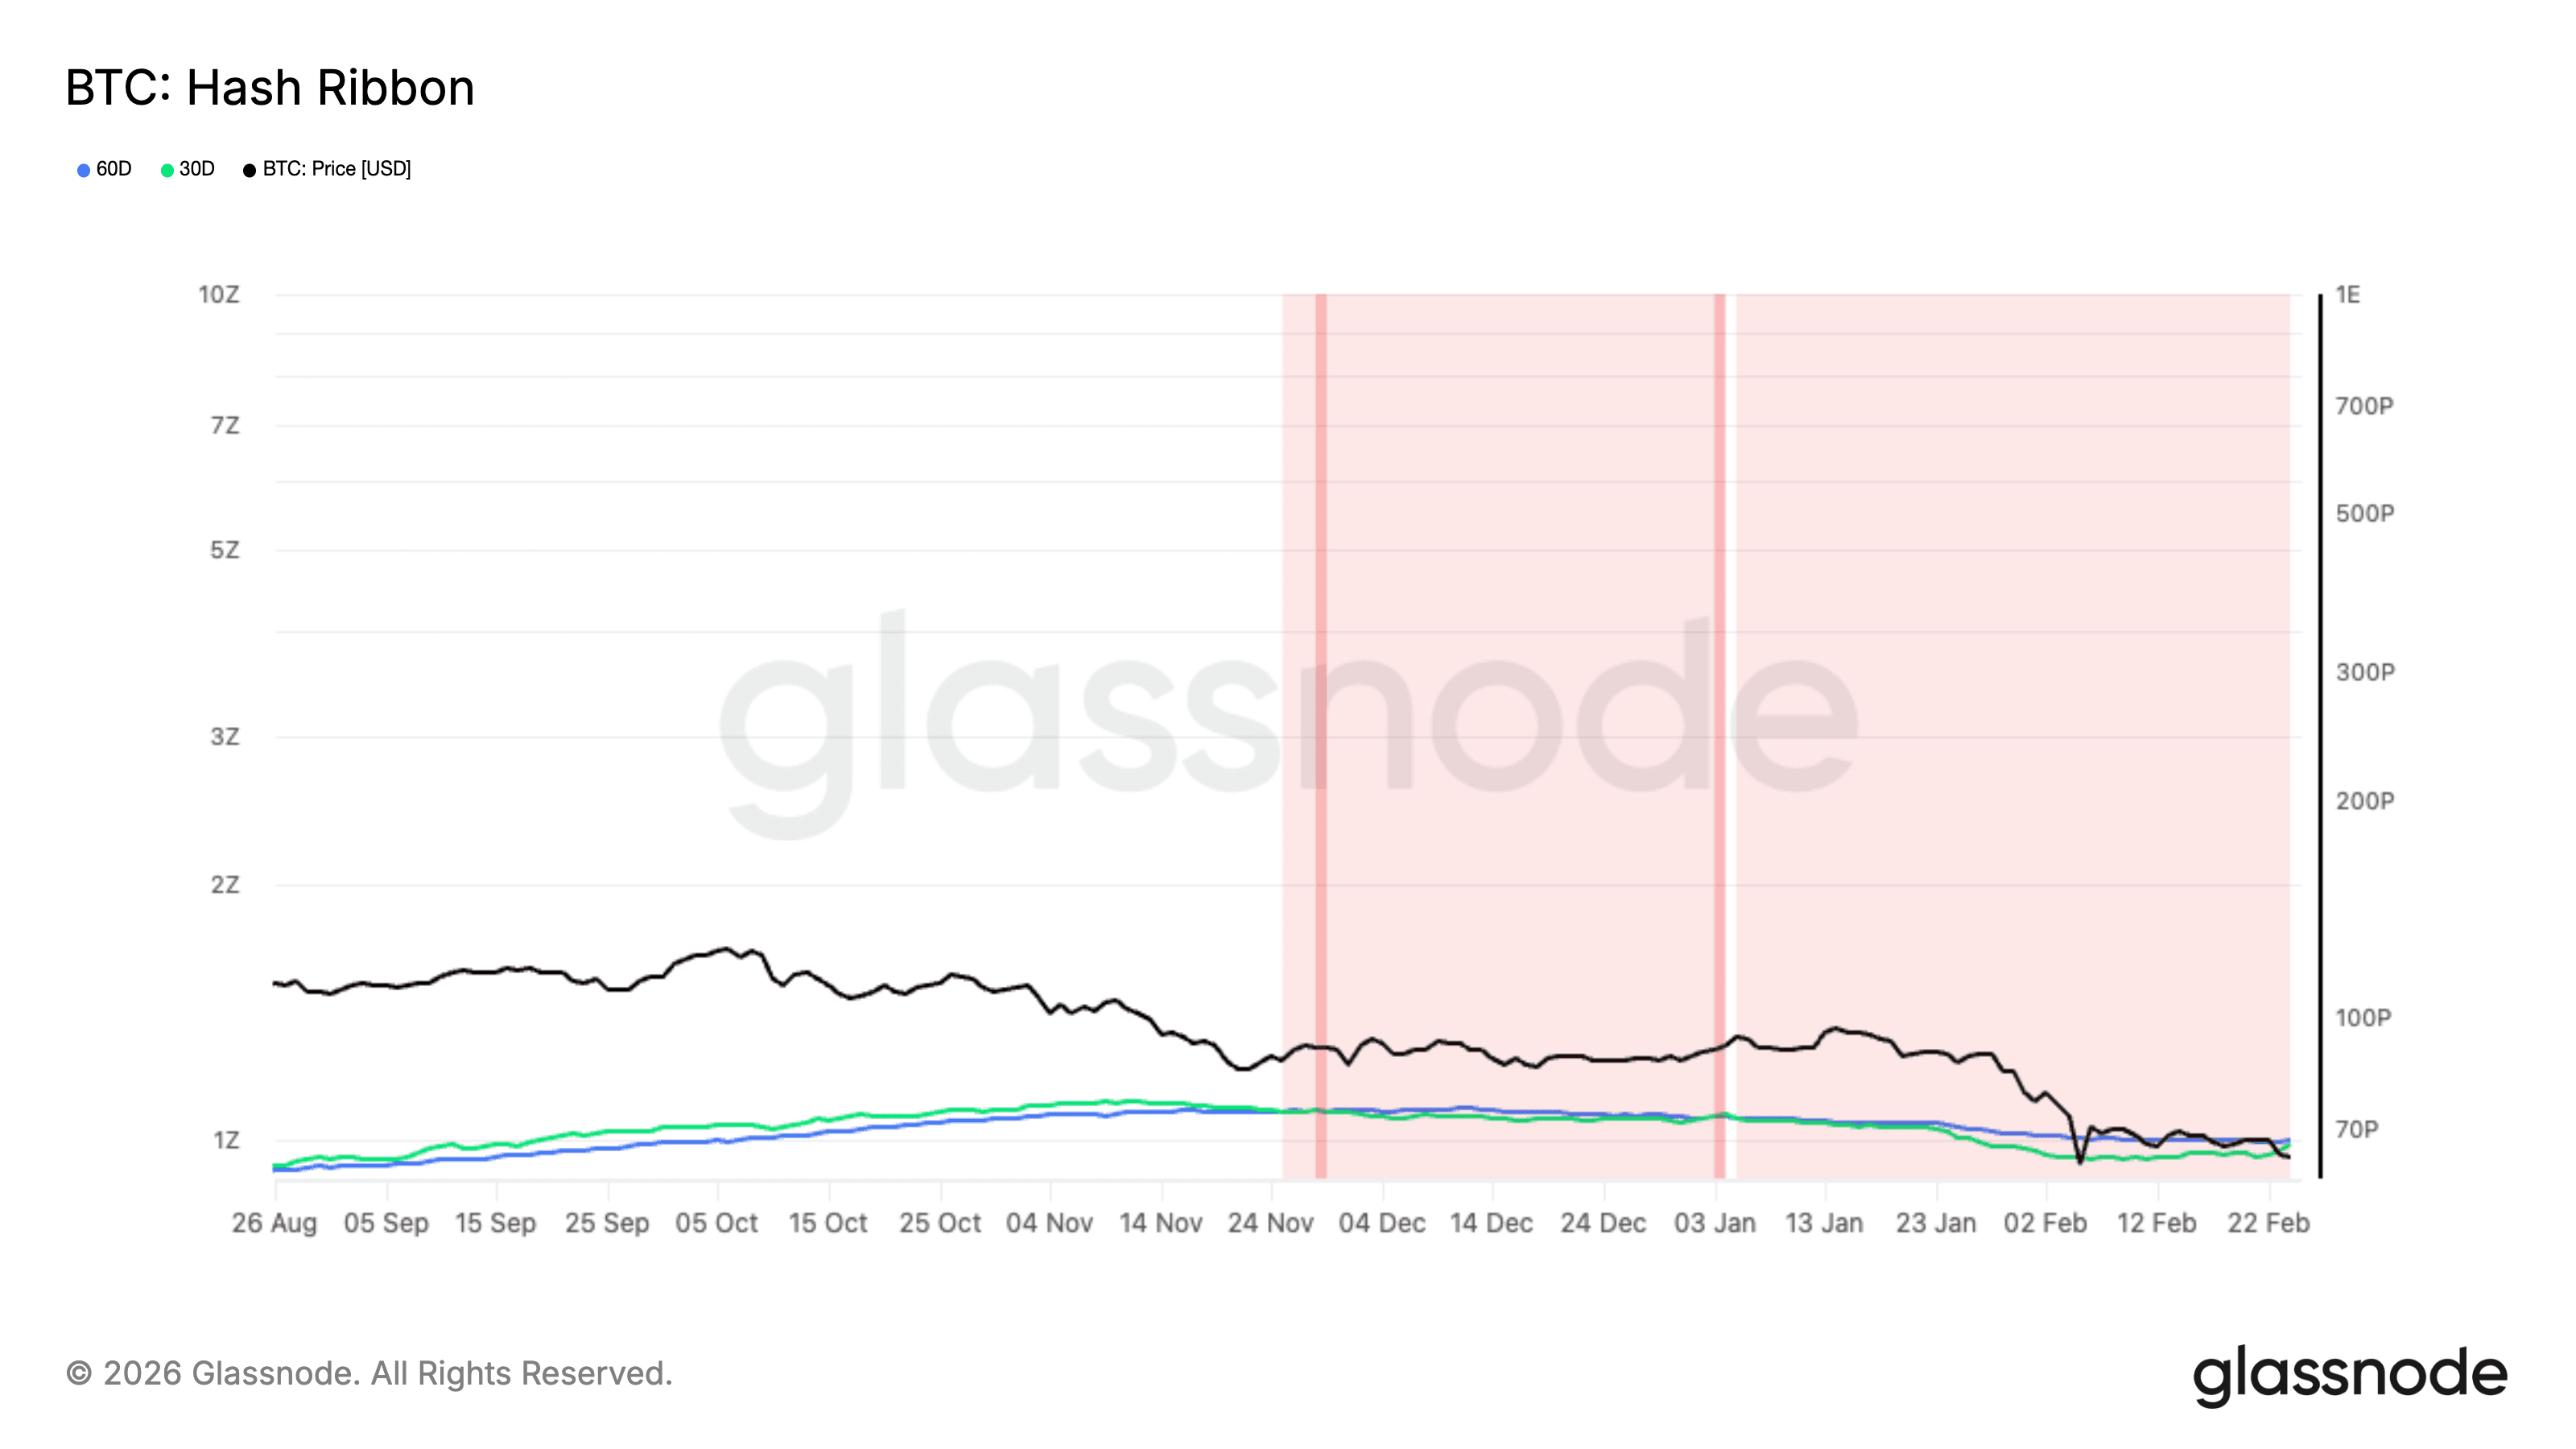
Image source: James Van Straten
What is “Miner Capitulation” and Why Is It Related to Price Bottoms?
In the cryptocurrency market, “miner capitulation” occurs when mining revenues are insufficient to cover electricity and operational costs, forcing inefficient miners to shut down equipment and sell their Bitcoin holdings to stay afloat. This collective selling pressure often causes the network’s hash rate to temporarily decline.
The Hash Ribbon indicator tracks the 30-day and 60-day moving averages (MA) of hash rate to assess market stress. When the 30-day MA crosses above the 60-day MA, it signals miners are coming back online, easing network pressure. Over the past decade, such crossovers have accurately marked important market lows, including those at the end of 2018 and 2022.
Data Analysis: Price Has Fallen Below “Average Production Cost”
In addition to the hash rate indicator, another piece of evidence supporting a bottom is Bitcoin’s production cost. Van Straten cites data from checkonchain, indicating that Bitcoin’s current trading price (around $65,000–$66,000) is below the estimated average production cost of $66,000.
When Bitcoin’s price drops below production costs, the market is generally considered to be in a “deep value zone.” This phenomenon is rare; the last time it occurred was in November 2022, when Bitcoin hit a cycle low of $15,500. Currently, the price falling below the cost line will further shake out the last weak holders, completing the capitulation process.

Disclaimer: The information on this page may come from third parties and does not represent the views or opinions of Gate. The content displayed on this page is for reference only and does not constitute any financial, investment, or legal advice. Gate does not guarantee the accuracy or completeness of the information and shall not be liable for any losses arising from the use of this information. Virtual asset investments carry high risks and are subject to significant price volatility. You may lose all of your invested principal. Please fully understand the relevant risks and make prudent decisions based on your own financial situation and risk tolerance. For details, please refer to
Disclaimer.
Related Articles
BTC drops 1.03% in 15 minutes: tighter macro liquidity and derivatives synchronized to amplify sell-off pressure
From 23:30 to 23:45 (UTC) on 2026-04-07, the BTC price rapidly fell within 15 minutes, with a return of -1.03%. The price range was 71,905.7 to 72,760.5 USDT, and the amplitude was 1.17%. Market attention remained high; intraday volatility significantly increased. Trading volumes across major platforms briefly surged, indicating that selling pressure and risk-avoidance sentiment had permeated mainstream cryptocurrencies.
The main drivers of this deviation were the continued tightening of macro liquidity under the Fed’s hawkish signals and a concentrated adjustment in the BTC derivatives market. The Fed’s interest rate in March 2026
GateNews33m ago
Peter Schiff Challenges Michael Saylor as Bitcoin Debate Heats Up
Peter Schiff and Michael Saylor recently debated Bitcoin's performance, with Schiff arguing it underperformed gold and equities over five years, while Saylor highlighted shorter-term gains. Their dispute illustrates the complexity of data selection in assessing investment viability.
CryptoFrontNews45m ago
BTC 15-minute surge of 1.07%: On-chain activity spikes and ETF fund inflows synchronize to drive the move
2026-04-07 22:45 to 2026-04-07 23:00 (UTC), the BTC price recorded a +1.07% return. The price range was 70,733.5 to 71,518.9 USDT, with a 1.11% amplitude. Short-term volatility intensified, drawing strong market attention. On-chain data shows the number of active addresses rose to 38,971, up 5.2% from the previous hour. The total number of addresses added approximately 252,780 within an hour; network activity and new user growth increased significantly, becoming the incremental market momentum behind the unusual move. Spot trading volume reached 11
GateNews1h ago
ETH 15-minute increase of 0.64%: Short-term capital inflows and sentiment shifts drive price fluctuations
2026-04-07 22:00 to 22:15 (UTC), the ETH price ranged between 2145.02 and 2165.83 USDT, and the 15-minute candlestick return reached +0.64%, with a trading range (amplitude) of 0.97%. Market volatility increased and attention rose, indicating short-term activity driven by rapid capital flows.
The main driving force behind this unusual move is that, in the short term, some funds flowed into ETH. Investors are focusing on ETH mainnet assets, and buying interest increased, pushing spot prices higher. At the same time, DeFi and stablecoin-related trading remained active, boosting on-chain liquidity and helping to support a
GateNews2h ago
BTC 15-minute jump of 0.52%: institutional capital inflows and derivatives leverage driving market upside
2026-04-07 22:00 to 2026-04-07 22:15 (UTC), BTC recorded a 15-minute K-line return of +0.52%, with a trading range of 69,919.3 to 70,561.1 USDT and a swing of 0.92%. This bout of abnormal movement occurred against the backdrop of BTC breaking through the $70,000 level, rising market attention, and heightened short-term volatility.
The main driving force behind this abnormal move was the inflow of large-scale institutional funds and a synchronized buy-side response tied to ETFs. Among them, an ETF product under a global asset management giant transferred 1,1
GateNews2h ago
XRP Stabilizes Near Key Levels Amid Fed Pressure and Rule Shift
Key Insights
XRP stabilized near $1.31 as macroeconomic pressures and declining liquidity combined to limit recovery momentum and increase short-term volatility risks significantly.
Proposed stablecoin regulations favor utility models, positioning RLUSD for growth while reducing incentives t
CryptoNewsLand2h ago
