
Key Takeaways
-
Immutable (IMX) is gaining attention as the gaming crypto sector shows renewed strength in both market cap and volume.
-
The weekly chart points to a developing Power of 3 (PO3) structure, often seen near major market bottoms.
-
IMX has completed a long accumulation phase and appears to be stabilizing after a manipulation-driven breakdown.
-
Reclaiming the $0.35 level and the 50-week moving average near $0.53 is crucial to confirm bullish continuation.
-
A breakout above $0.815 could open the door for a larger upside move toward the $1.42 region in the coming months.
In the cryptocurrency market today, gaming tokens are back in the spotlight, with** Immutable (IMX) **drawing increased attention. The overall gaming narrative market cap has climbed by 2.99%, while trading volume has jumped a notable 9.57% over the past 24 hours.
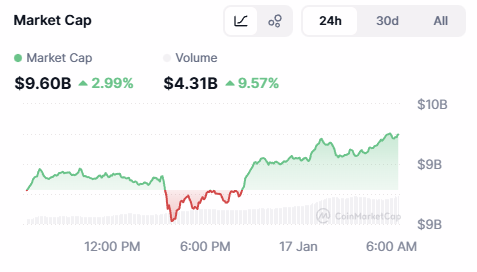
Source: Coinmarketcap
Riding this momentum, IMX is up nearly 7% on the day. More importantly, the higher-timeframe chart is beginning to reveal a larger technical structure that could be setting the stage for a meaningful upside move in the weeks ahead.
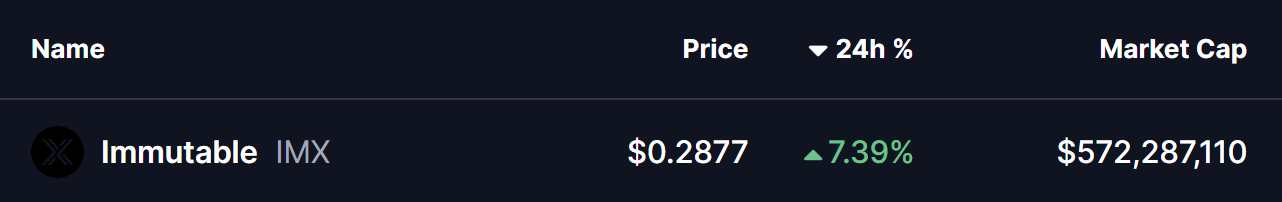
Source: Coinmarketcap
Weekly Chart Signals a Bullish Move
From a technical perspective, the weekly **IMX **chart suggests the formation of a classic Power of 3 (PO3) structure — a pattern often seen near major market bottoms and trend transitions. This setup typically unfolds in three phases: accumulation, manipulation, and expansion, with the strongest price move usually emerging once the expansion phase begins.
Accumulation Phase
Between February and November 2025, IMX spent an extended period consolidating within a clearly defined range. Price action remained capped near the $0.815 resistance zone, while buyers consistently defended the $0.35 support area. This prolonged sideways movement reflects steady accumulation, where long-term participants quietly build positions while volatility remains compressed.
Manipulation Phase
During the broader market downturn in November 2025, IMX broke decisively below the $0.35 accumulation support, sliding toward a local low around $0.2031. This sharp breakdown, highlighted on the chart by the lower shaded zone, aligns well with the manipulation phase of the Power of 3 pattern.
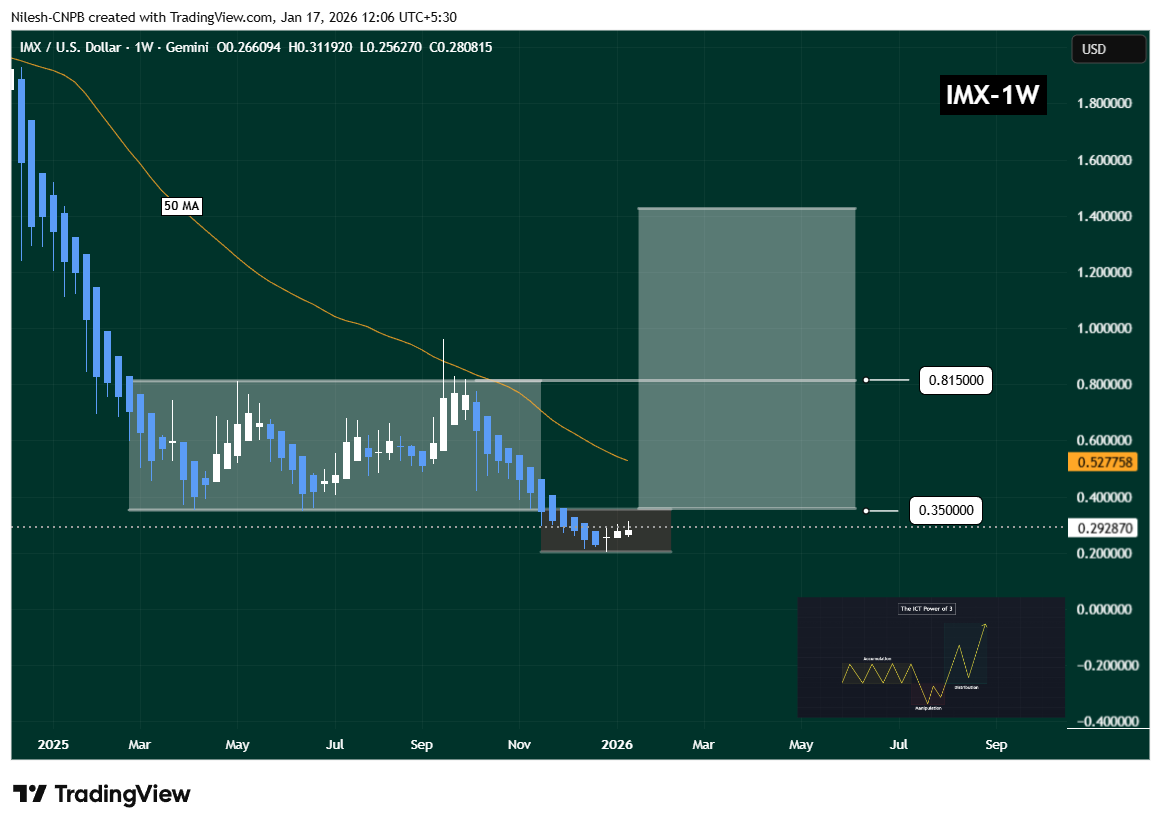
Immutable (IMX) Weekly Chart/Coinsprobe (Source: Tradingview)
At this stage, stop losses are triggered, sentiment turns bearish, and weaker hands are forced out of the market. Notably, selling pressure has started to fade near this region, with IMX now trading around $0.2928 — an early sign that downside momentum may be losing steam.
What Comes Next for IMX?
Currently, IMX remains in the lower portion of the manipulation phase, trading just below the crucial $0.35 level. This zone is particularly important, as it previously acted as strong accumulation support and now serves as a key decision area.
For bullish momentum to gain credibility, IMX must first reclaim $0.35 and then push above the 50-week moving average, which sits near $0.5277. A sustained move above these levels would strongly suggest a transition into the expansion phase of the Power of 3 structure, where upside momentum typically accelerates.
If price manages to break and hold above the $0.815 resistance, the longer-term chart projection opens the door toward the $1.42 region in the coming months — a level that aligns with prior structural targets on the weekly timeframe.
That said, the setup remains conditional. As long as IMX trades below $0.35, downside risks cannot be completely ruled out, and price may continue to experience volatility. Holding current lows and reclaiming key resistance zones will be critical for bulls to confirm a broader trend reversal.
Bottom Line
While Immutable (IMX) has already posted a strong short-term bounce, the bigger story lies in its higher-timeframe structure. The ongoing stabilization near cycle lows, combined with a developing Power of 3 pattern, suggests that IMX could be preparing for a larger move — provided key levels are reclaimed. For now, patience is warranted, but the chart hints that the worst of the downside may already be behind.
Frequently Asked Questions (FAQ)
Is Immutable (IMX) bullish right now?
IMX is showing early signs of stabilization after a deep correction. While it is not fully bullish yet, reclaiming $0.35 and the 50-week moving average would significantly strengthen the bullish case.
What is the Power of 3 pattern in crypto trading?
The Power of 3 (PO3) is a market structure consisting of accumulation, manipulation, and expansion phases. It is often seen near major bottoms before strong trend reversals.
Disclaimer: The views and analysis presented in this article are for informational purposes only and reflect the author’s perspective, not financial advice. Technical patterns and indicators discussed are subject to market volatility and may or may not yield the anticipated results. Investors are advised to exercise caution, conduct independent research, and make decisions aligned with their individual risk tolerance.
About Author: Nilesh Hembade is the Founder and Lead Author of Coinsprobe, with over 5 years of experience in the cryptocurrency and blockchain industry. Since launching Coinsprobe in 2023, he has been providing daily, research-driven insights through in-depth market analysis, on-chain data, and technical research.
Disclaimer: The information on this page may come from third parties and does not represent the views or opinions of Gate. The content displayed on this page is for reference only and does not constitute any financial, investment, or legal advice. Gate does not guarantee the accuracy or completeness of the information and shall not be liable for any losses arising from the use of this information. Virtual asset investments carry high risks and are subject to significant price volatility. You may lose all of your invested principal. Please fully understand the relevant risks and make prudent decisions based on your own financial situation and risk tolerance. For details, please refer to
Disclaimer.
Related Articles
ATOM Eyes 15% Gain: Technical Indicators Point to Possible Upswing
ATOM broke a long bearish trend with a 5.25% price increase.
Price must close above $1.77 to confirm a potential 15% rally.
Top holders and rising Open Interest indicate growing bullish sentiment among traders.
Cosmos — ATOM, has started showing signs of breaking free from a long bearish
CryptoNewsLand22m ago
Bitcoin’s implied volatility drops to an intra-year low, and the market is reacting mildly to Friday’s CPI data
April 9, U.S. March CPI data will be released on April 11. The market expects the year-over-year rate to rise from 2.4% to 3.4%. The Bitcoin market has responded calmly, with the options market’s volatility range only at 2.5%. Attention has been drawn by the rise in gasoline prices. Analysts believe that CPI data coming in either too soft or too hot will have different impacts on the crypto market.
GateNews1h ago
XRP Stabilizes Near Key Levels Amid Fed Pressure and Rule Shift
Key Insights
XRP stabilized near $1.31 as macroeconomic pressures and declining liquidity combined to limit recovery momentum and increase short-term volatility risks significantly.
Proposed stablecoin regulations favor utility models, positioning RLUSD for growth while reducing incentives t
CryptoNewsLand1h ago
XRP Today’s News: Institutional funds return, circulating inflow of 120 million exceeds Bitcoin
This week, XRP recorded a $119.6 million capital inflow, setting the highest mark since 2025 and becoming a major beneficiary in the crypto market. This round of funds returning was mainly driven by greater clarity in regulatory policy and XRP’s real-world use in cross-border payment infrastructure. Technically, it shows an initial recovery, but overall it is still in a downward channel. The support and resistance levels are $1.31 and $1.40, respectively; if it breaks through, it is expected to reach $1.50.
MarketWhisper4h ago
XRP drops to $1.33, with $3.32 million in ETF inflows still failing to reverse the downtrend; the key support to watch is $1.28
In April 2026, the XRP price pulled back to $1.33, down about 4%. Although there was capital inflow into Ripple-related products, selling pressure dominated the market, and increased trading volume signaled distribution. Declining liquidity further heightens volatility risk; watch the $1.33 support—if it breaks, prices will likely fall further. For a short-term rebound, it needs to break above $1.35; otherwise, it should remain in a weak range-bound consolidation.
GateNews4h ago
XRP Price Structure Signals More Downside — Key Levels to Watch
XRP fails to make new highs, confirming bearish market structure remains intact.
Price targets $1.13, $1.08, and potentially $0.87 support levels.
Traders should wait for confirmation instead of reacting to short-term price moves.
Short bursts of green candles can quickly shift market
CryptoNewsLand4h ago
