Hedera (HBAR) is currently fluctuating around the 0.127 USD level during Wednesday’s trading session, approaching a key resistance zone. If the price convincingly breaks through this level, the market could witness a new upward momentum in the near future. Notably, demand from institutional investors continues to increase, as spot HBAR ETF funds have recorded three consecutive days of net inflows this week. Simultaneously, positive signals from on-chain data and derivatives markets further reinforce the expectation that HBAR is on the verge of extending its bullish trend.
Institutional demand for HBAR continues to grow
Demand from institutional investors for Hedera has shown a clear increase this week. According to data from SoSoValue, spot Hedera ETF funds attracted $817,770 in capital on Tuesday, marking the third consecutive day of positive inflows since last week. This development reflects strong investor confidence and opens up the possibility that if capital inflows continue and increase, HBAR could extend its current upward trend.
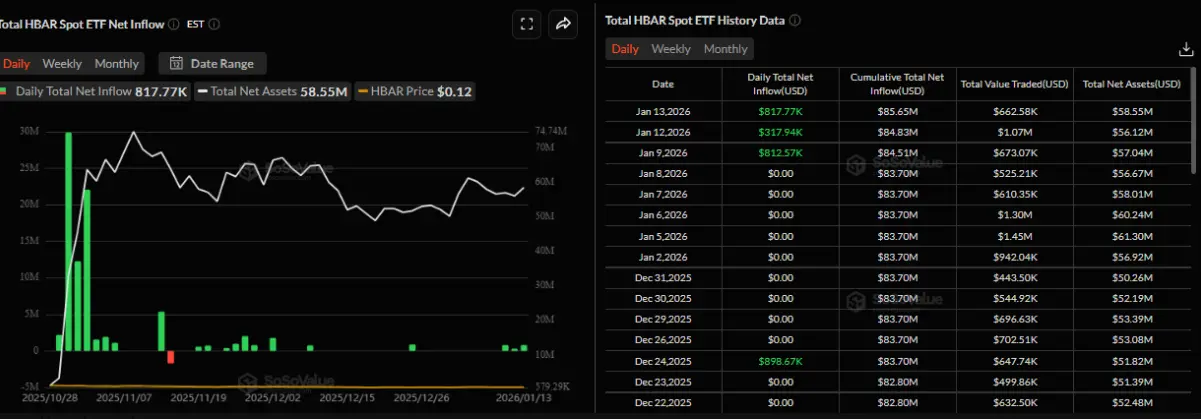 Total net inflow chart into HBAR spot ETFs## Positive on-chain and derivatives indicators
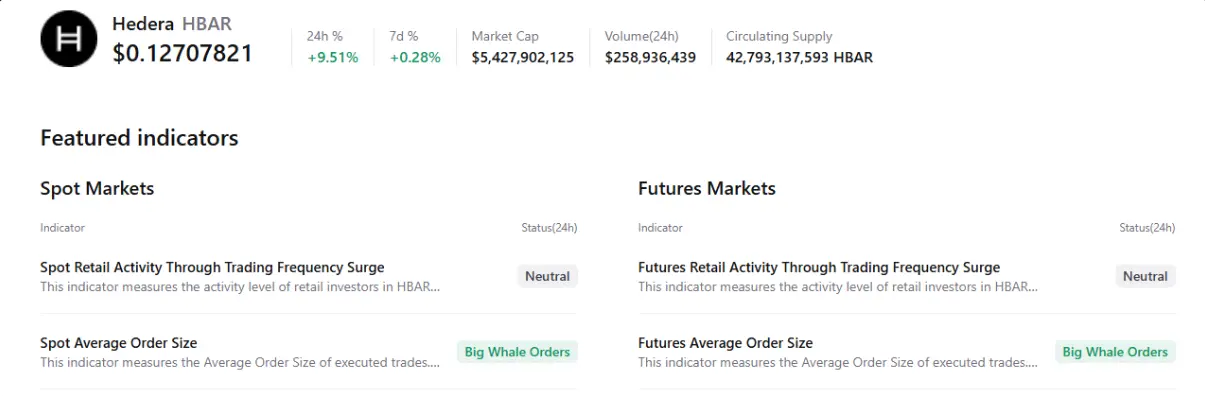
Data from the CryptoQuant chart below further strengthen HBAR’s positive outlook, as both the spot market and futures contracts show large buy orders from whales. This movement is often seen as an early signal that a new bullish phase may be forming in the near future.
In the derivatives market, bullish sentiment is also becoming more evident. According to Coinglass, the long/short ratio of HBAR reached 1.06 on Wednesday — the highest in over a month. Maintaining this ratio above 1 indicates that most traders are leaning towards a bullish scenario, reflecting growing confidence in Hedera’s continued upward movement.
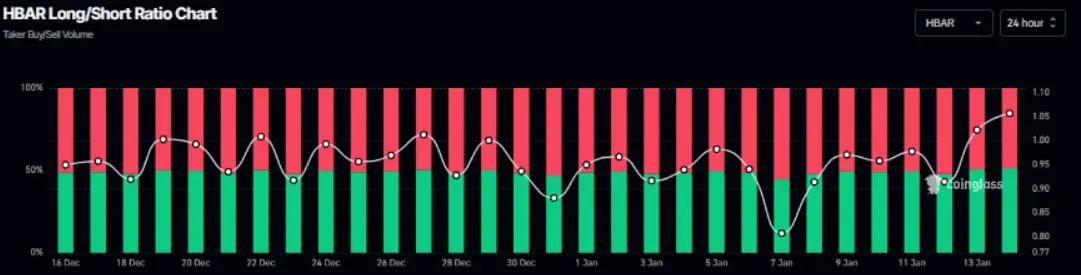 Hedera long/short ratio chart | Source: Coinglass## Hedera Price Forecast: HBAR could extend its rally if it closes above the 50-day EMA
Hedera (HBAR) is currently moving within a descending wedge pattern formed since late July, with highs and lows gradually narrowing. Notably, HBAR surged over 6% during Tuesday’s trading session, indicating renewed buying interest. As of Wednesday, the price is approaching the 50-day exponential moving average (EMA) around the 0.127 USD mark — an important technical level.
In a positive scenario, if HBAR can close firmly above the 50-day EMA, the recovery momentum is likely to continue, pushing the price toward the upper trendline of the wedge pattern, around 0.152 USD.
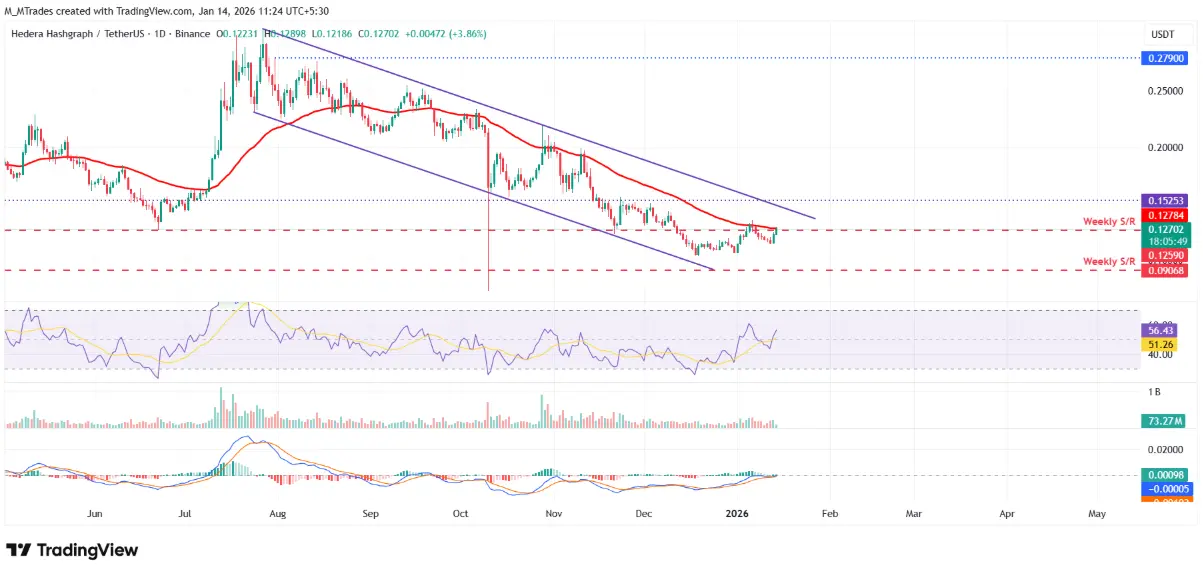 Daily HBAR/USDT chart | Source: TradingView Technical indicators also support a bullish outlook. The daily RSI stands at 56, rising above the neutral 50 level, indicating increasing buying momentum. Meanwhile, the MACD continues to show a bullish crossover, further strengthening the optimistic scenario.
However, the risk of a correction should not be overlooked. If selling pressure increases, HBAR could reverse and decline toward the weekly support zone around 0.090 USD, where demand is expected to re-emerge.
SN_Nour
Disclaimer: The information on this page may come from third parties and does not represent the views or opinions of Gate. The content displayed on this page is for reference only and does not constitute any financial, investment, or legal advice. Gate does not guarantee the accuracy or completeness of the information and shall not be liable for any losses arising from the use of this information. Virtual asset investments carry high risks and are subject to significant price volatility. You may lose all of your invested principal. Please fully understand the relevant risks and make prudent decisions based on your own financial situation and risk tolerance. For details, please refer to
Disclaimer.
Related Articles
Why is Bitcoin down today? Saudi petrochemical industrial facilities were hit, and Trump issued an ultimatum to Iran
Bitcoin (BTC) fell to about $68,800 on April 7, driven by geopolitical risks in the Middle East and Trump’s hardline remarks toward Iran. The Saudi explosion incident boosted global safe-haven sentiment, and technical indicators showed overbought pressure. In addition, Bitcoin’s key support lies in the $67,500 to $69,500 range; if it breaks below $66,000, the risk will widen to $64,000. Several analysts believe the pullback is more like a healthy correction rather than a trend reversal.
MarketWhisper8m ago
The Crypto Fear and Greed Index fell to 11 today, and the market is still in an extreme state of fear
Gate News, April 7: According to Alternative.me data, the Crypto Fear and Greed Index today dropped to 11, down further from yesterday’s 13. The market remains in an “extreme fear” state.
GateNews1h ago
Can Trump’s ultimatum stop the ceasefire? Oil prices are rising, and Bitcoin has fallen to 68K
The market is concerned about the impending military action, causing U.S. crude oil (WTI) prices to break above $112 per barrel and the stock market to rise slightly. Bitcoin briefly climbed to $70,351, then subsequently fell to $68K, and Ether also dropped below $2,100. Investors are watching the Federal Reserve meeting minutes and the inflation indicator PCE data, as the economic outlook remains unclear.
ChainNewsAbmedia1h ago
BTC 15-minute drop of 0.62%: whale capital inflows into exchanges spark short-term sell pressure
2026-04-06 22:45 to 23:00 (UTC), BTC fell 0.62% in short-term trading. The price fluctuated between 68812.1 and 69240.0 USDT, with an amplitude of 0.62%. Trading volume rose in sync during this period, market attention increased noticeably, volatility risk rose, and short-term investors’ sentiment turned cautious.
The main driving force behind this unusual move is that on-chain data shows whales holding large amounts of BTC are concentrating funds to exchanges. Within 10 minutes, the total amount of funds transferred was about $420,000; within 24 hours, it reached 867.28 BTC, even higher. Then
GateNews2h ago
BTC drops below 69,000 USDT, and the 24-hour gain narrows to 1.25%
Gate News update: On April 6, market data shows that BTC has broken below 69,000 USDT, currently trading at 68,979.5 USDT. The 24-hour gain has narrowed to 1.25%.
GateNews2h ago
Bitcoin Eyes $80,000 Milestone As Geopolitical Tensions in the Strait of Hormuz Reach a Boiling P...
The crypto market currently is at a pivotal point where technical momentum meets intense global uncertainty. After being stuck in a holding pattern for many weeks, BTC now appears poised to break out again as geopolitical narratives shift and additional volatility is expected. Top crypto analyst
BlockChainReporter3h ago
