- MemeCore is trading in a narrow range, suggesting short-term consolidation.
- Support near $1.55 and resistance at $1.89 will be key levels to watch.
MemeCore (M) has been moving sideways in recent weeks, with the price currently around $1.69. After a period of decline, the token is now showing early signs of stabilization, trading in a narrow range between support and resistance. The chart suggests that MemeCore may be forming a short-term consolidation pattern, sometimes referred to as a rectangle or range-bound structure, where the price oscillates between defined support and resistance levels.
Over the past 24 hours, the price of this memecoin climbed about 3%, reaching an intraday high of $1.71 and a low of $1.62. Its market cap currently stands at $2.1 billion, with a trading volume of $14.7 million.
Sideways Momentum Suggests the Market Is Taking a Breather
Looking at the 24 hours trading pattern, MemeCore is positioned between the 50-day moving average at $1.555 and the 100-day moving average at $1.889. The 50-day moving average is slowly flattening, indicating that immediate selling pressure is easing. The 100-day moving average remains above the current price, suggesting the broader trend is still slightly weak. Overall, the averages show that the market is in a recovery phase but hasn’t fully returned to an uptrend yet.
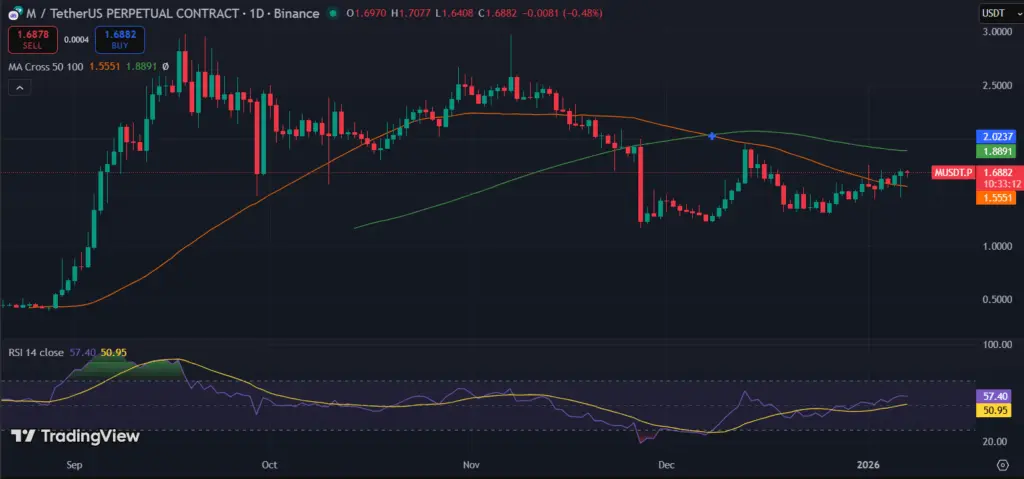 (Source: TradingView)MemeCore’s daily RSI stands at 57, showing that momentum is mildly positive. This indicates that buyers are gradually returning, but there isn’t a strong push higher yet. The market isn’t oversold or overbought, which fits with the sideways price action seen on the chart.
Immediate support is around $1.55–$1.56, which has helped prevent further declines in recent sessions. A stronger support level exists near $1.50, which could provide a safety net if the price dips further. On the upside, MemeCore’s resistance is seen at $1.89, near the 100-day moving average, followed by $2.02, which previously acted as a barrier. Breaking above these levels would be necessary for any meaningful upward movement.
Disclaimer: The information on this page may come from third parties and does not represent the views or opinions of Gate. The content displayed on this page is for reference only and does not constitute any financial, investment, or legal advice. Gate does not guarantee the accuracy or completeness of the information and shall not be liable for any losses arising from the use of this information. Virtual asset investments carry high risks and are subject to significant price volatility. You may lose all of your invested principal. Please fully understand the relevant risks and make prudent decisions based on your own financial situation and risk tolerance. For details, please refer to
Disclaimer.
Related Articles
Solana Recovery Gains Pace While Derivatives Data Shows Split Sentiment
Key Insights
Solana records four consecutive days of gains as funding rates rise, signaling stronger retail interest while overall market conviction remains divided across participants.
Declining futures Open interest alongside rising funding rates highlights reduced trader exposure,
CryptoNewsLand34m ago
ATOM Eyes 15% Gain: Technical Indicators Point to Possible Upswing
ATOM broke a long bearish trend with a 5.25% price increase.
Price must close above $1.77 to confirm a potential 15% rally.
Top holders and rising Open Interest indicate growing bullish sentiment among traders.
Cosmos — ATOM, has started showing signs of breaking free from a long bearish
CryptoNewsLand1h ago
Bitcoin’s implied volatility drops to an intra-year low, and the market is reacting mildly to Friday’s CPI data
April 9, U.S. March CPI data will be released on April 11. The market expects the year-over-year rate to rise from 2.4% to 3.4%. The Bitcoin market has responded calmly, with the options market’s volatility range only at 2.5%. Attention has been drawn by the rise in gasoline prices. Analysts believe that CPI data coming in either too soft or too hot will have different impacts on the crypto market.
GateNews2h ago
XRP Stabilizes Near Key Levels Amid Fed Pressure and Rule Shift
Key Insights
XRP stabilized near $1.31 as macroeconomic pressures and declining liquidity combined to limit recovery momentum and increase short-term volatility risks significantly.
Proposed stablecoin regulations favor utility models, positioning RLUSD for growth while reducing incentives t
CryptoNewsLand2h ago
XRP Today’s News: Institutional funds return, circulating inflow of 120 million exceeds Bitcoin
This week, XRP recorded a $119.6 million capital inflow, setting the highest mark since 2025 and becoming a major beneficiary in the crypto market. This round of funds returning was mainly driven by greater clarity in regulatory policy and XRP’s real-world use in cross-border payment infrastructure. Technically, it shows an initial recovery, but overall it is still in a downward channel. The support and resistance levels are $1.31 and $1.40, respectively; if it breaks through, it is expected to reach $1.50.
MarketWhisper4h ago
XRP drops to $1.33, with $3.32 million in ETF inflows still failing to reverse the downtrend; the key support to watch is $1.28
In April 2026, the XRP price pulled back to $1.33, down about 4%. Although there was capital inflow into Ripple-related products, selling pressure dominated the market, and increased trading volume signaled distribution. Declining liquidity further heightens volatility risk; watch the $1.33 support—if it breaks, prices will likely fall further. For a short-term rebound, it needs to break above $1.35; otherwise, it should remain in a weak range-bound consolidation.
GateNews5h ago
