Pump.fun (PUMP) is making a strong breakout along with the upward trend of leading cryptocurrencies like Bitcoin (BTC). As of Wednesday, PUMP is trading steadily above the $0.002400 mark. The outlook for this token continues to lean positive, extending the upward momentum established since December 30.
PUMP’s rally is likely to continue this week, especially as the meme coin trading wave remains hot. Notably, Pump.fun is asserting itself as one of the top meme coin trading platforms in the market, with DEX trading volume surpassing $1.28 billion.
Increasing demand for meme coins reinforces PUMP’s recovery prospects
Meme coin trading activity has surged dramatically in recent days, leading to a sharp increase in trading volume on decentralized exchanges. Specifically, DEX volume on Pump.fun soared to $1.28 billion as of Monday, a significant rise from approximately $805 million recorded the previous day.
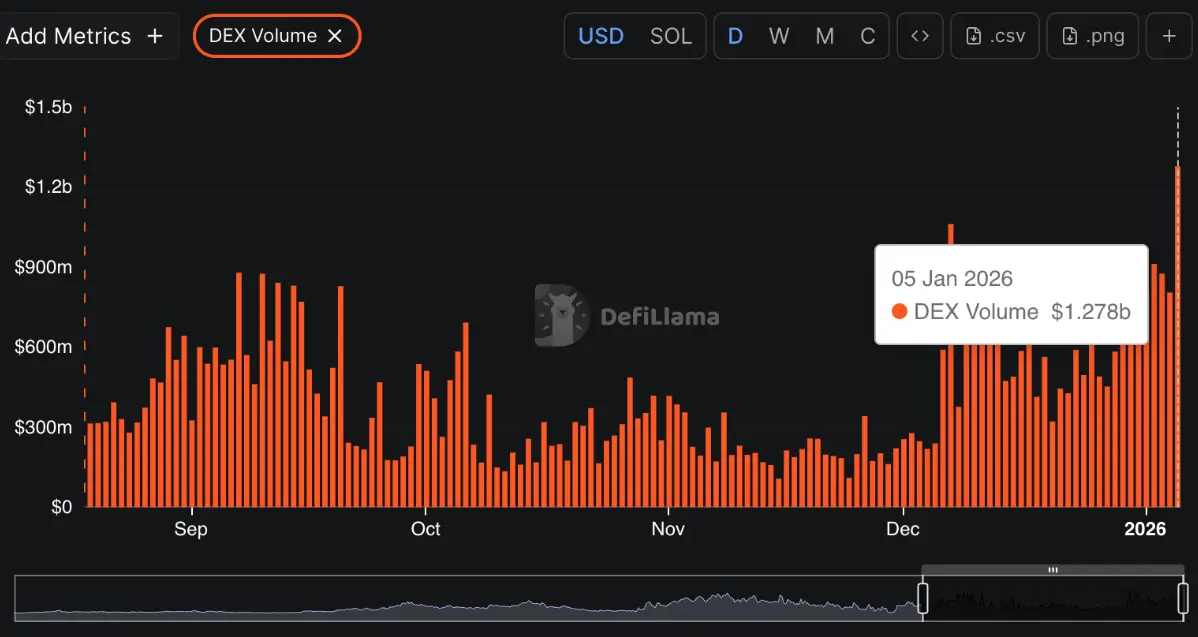 Pump.fun DEX Volume | Source: DefiLlama This lively trading wave benefits PUMP in multiple ways. Most notably, through a buyback mechanism tied directly to platform revenue, where Pump.fun allocates nearly all revenue to buy back PUMP on the market. This approach is expected to support the price and increase the long-term value of the token. Additionally, PUMP also functions as a governance token, allowing holders to participate directly in key ecosystem decisions.
Conversely, retail investor interest in PUMP has been gradually improving since the beginning of the year, although at a cautious pace. According to data from CoinGlass, open interest (OI) in the futures market reached an average of $231 million on Wednesday, up from about $207 million on Monday and $150 million at the end of last week.
The steady increase in OI reflects growing trader confidence in the ability to sustain the short-term recovery of PUMP. This optimism is encouraging retail investors to accept higher risks, thereby adding upward pressure on the market.
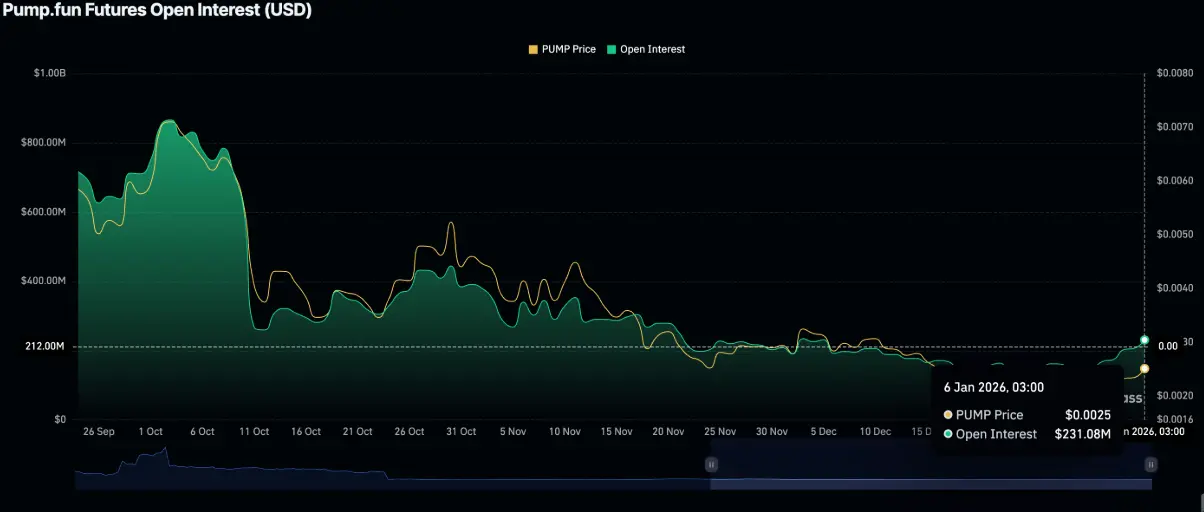 PUMP Futures Open Interest | Source: CoinGlass## Technical Analysis: PUMP aims for a short-term breakout
As of Tuesday, PUMP was trading around the $0.002400 level. On the daily timeframe, the MACD indicator still signals a positive trend, reinforcing short-term bullish expectations.
Specifically, the MACD (blue) line continues to show positive divergence and remains above the signal line (red) since December 31. Meanwhile, the histogram bars keep expanding above the moving average, indicating that bullish momentum remains dominant.
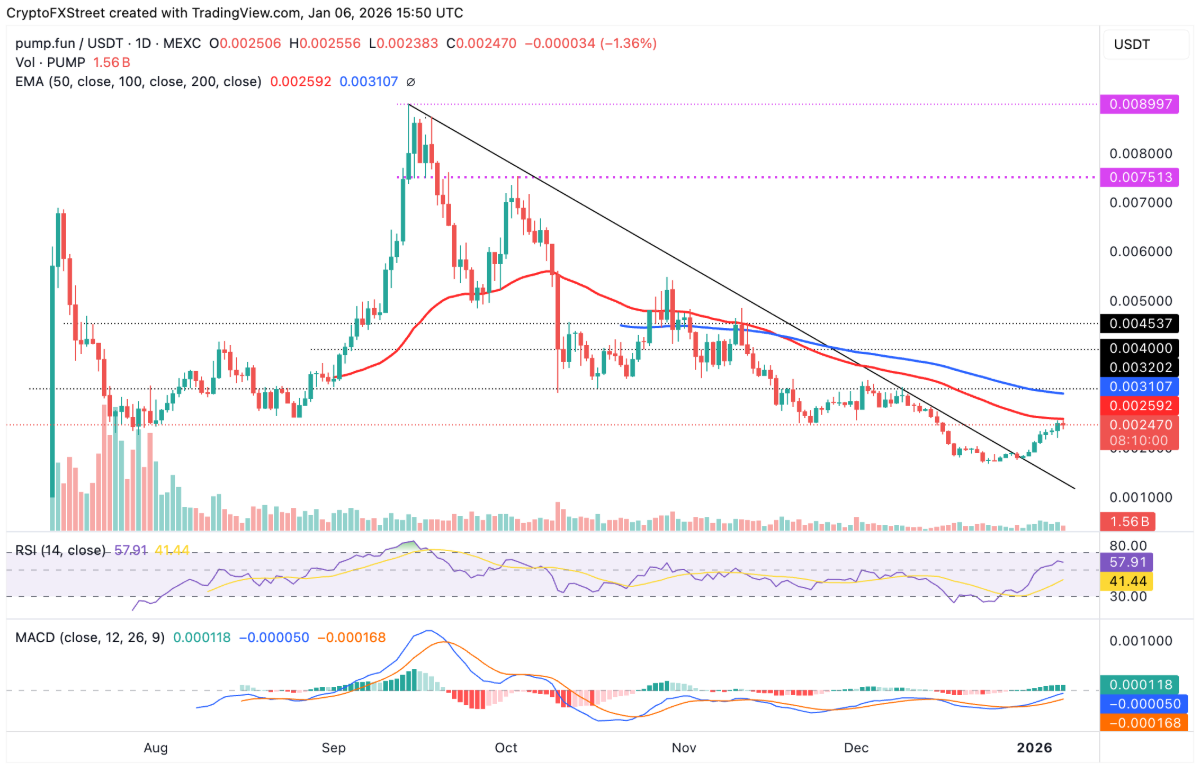 Daily PUMP/USDT Chart | Source: TradingView However, to clearly confirm the recovery potential and attract more trader inflows, PUMP needs to close firmly above the 50-day exponential moving average (EMA) at $0.002992. Breaking this resistance would make the 100-day EMA the next challenge, potentially capping gains around $0.003107.
On the downside, the RSI indicator currently at 58 signals weakening momentum and a possible retreat toward the neutral zone. This suggests increasing profit-taking pressure, causing buying strength to diminish. In a continued correction scenario, support around $0.002000 will be a key area to watch, opening opportunities for new entry points for investors.
SN_Nour
Disclaimer: The information on this page may come from third parties and does not represent the views or opinions of Gate. The content displayed on this page is for reference only and does not constitute any financial, investment, or legal advice. Gate does not guarantee the accuracy or completeness of the information and shall not be liable for any losses arising from the use of this information. Virtual asset investments carry high risks and are subject to significant price volatility. You may lose all of your invested principal. Please fully understand the relevant risks and make prudent decisions based on your own financial situation and risk tolerance. For details, please refer to
Disclaimer.
Related Articles
QCP: BTC Oscillates Near $74,000; Multi-Country Central Bank Rate Decisions Key This Week
QCP Capital analysis indicates that BTC price is maintaining around $74,000, with a lack of upward momentum. Although the overall crypto market remains under pressure, the declines are relatively controlled. Central bank policy meetings throughout the year will influence the market, as high oil prices have lowered expectations for rate cuts, and the interest rate environment has weakened support for crypto assets. Until policy and geopolitical situations become clearer, a volatile pattern may continue.
GateNews1h ago
Analyst: The overheated bubble of Bitcoin (BTC) has been absorbed, but selling pressure still remains.
On-chain analyst Axel's research report indicates that the Bitcoin market has returned to a neutral range, but overall remains in a loss state with unrelenting selling pressure. The MVRV Z-Score shows that valuation bubbles have dissipated; however, aSOPR has remained below 1.0 for 55 consecutive days, indicating sustained selling pressure. Axel emphasizes that the key to the market lies in whether selling pressure will be exhausted, requiring observation of whether aSOPR can stabilize above 1.0.
動區BlockTempo1h ago
Citigroup Slashes Bitcoin and Ethereum 12-Month Price Targets, Citing Stalled U.S. Crypto Legislation Weighing on Upside Catalysts
Citigroup has lowered its 12-month price targets for Bitcoin and Ethereum, signaling a shift toward caution on the cryptocurrency market's medium-term outlook, primarily due to slow progress in U.S. crypto asset legislation. Bitcoin's target was reduced from $143,000 to $112,000, while Ethereum's fell to $3,175. Despite upside potential remaining in the future, the lack of new policy catalysts suggests prices may oscillate within a range in the near term. Citigroup's assessment of Ethereum is more cautious, as it believes the asset is more significantly impacted by on-chain activity.
区块客2h ago
Bitcoin Holds Strong at $70,000! On-Chain Data Reveals "Collective Selling Wave," Retail Investors Emerge as Biggest Selling Pressure
Under Middle East geopolitical tensions, Bitcoin faced widespread selling pressure, particularly from retail holders. According to Glassnode data, the market is experiencing heavy selling pressure, with the accumulated trend score declining to 0.04, indicating that retail and small-to-medium investors are reducing their positions significantly. Despite this, Bitcoin's resilience against the decline has surprised market observers.
区块客2h ago
ENJ Rockets Past $0.027 — 23% Surge Signals Momentum
Enjin Coin has surged 22.96% in 30 minutes, reaching $0.02737, reflecting increased trading activity and market interest. With a 24-hour change of +43.30%, traders are monitoring support at $0.025 and resistance at $0.030, suggesting potential trends ahead.
Coinfomania2h ago
Ethereum Returns to $2,300: Whales Accumulate 540,000 ETH, Exchange Inflows Drop to 10-Month Low
Ethereum's price rebounded above $2,300 on March 18, primarily driven by whale purchases and net exchange outflows. On-chain data shows investors have reduced their selling pressure, with supply tightening. Technical indicators reveal short-term resistance at $2,380 to $2,400, with support near $2,320. The futures market is also displaying positive signals.
GateNews3h ago
