
Date: Mon, Dec 29, 2025 | 04:10 PM GMT
The broader cryptocurrency market has seen a short-term pullback over the past few hours, with Bitcoin (BTC) slipping below the $87K level after briefly trading above $90K. This retracement has spilled over into major altcoins, including Avalanche (AVAX), which is also experiencing mild selling pressure.
AVAX is trading slightly in the red today, but beneath the surface, its price structure is beginning to tell a more constructive story. The 4-hour chart reveals a high-probability bullish setup that could hint at a stronger upside move once momentum fully shifts back in favor of buyers.
Source: Coinmarketcap
Power of 3 Pattern Takes Shape
On the 4-hour timeframe, AVAX appears to be forming a classic Power of 3 (PO3) pattern — a structure commonly linked to smart money accumulation and trend continuation. This pattern typically unfolds in three distinct phases: accumulation, manipulation, and expansion, often preceding a sharp directional move.
Accumulation Phase
During the accumulation phase, AVAX spent an extended period trading sideways within a defined range, capped by resistance near $14.80 and supported around $12.64. This tight consolidation reflected balance between buyers and sellers, allowing larger participants to quietly build positions while volatility remained compressed.
The prolonged range-bound action signaled that selling pressure was gradually being absorbed, even as the broader trend remained weak.
Manipulation Flush
The manipulation phase played out when AVAX briefly broke below the $12.64 support, triggering a sharp downside move toward the $11.31 area. This sudden drop resembles a classic liquidity sweep, where stop-loss orders and late sellers are flushed out before a reversal takes place.
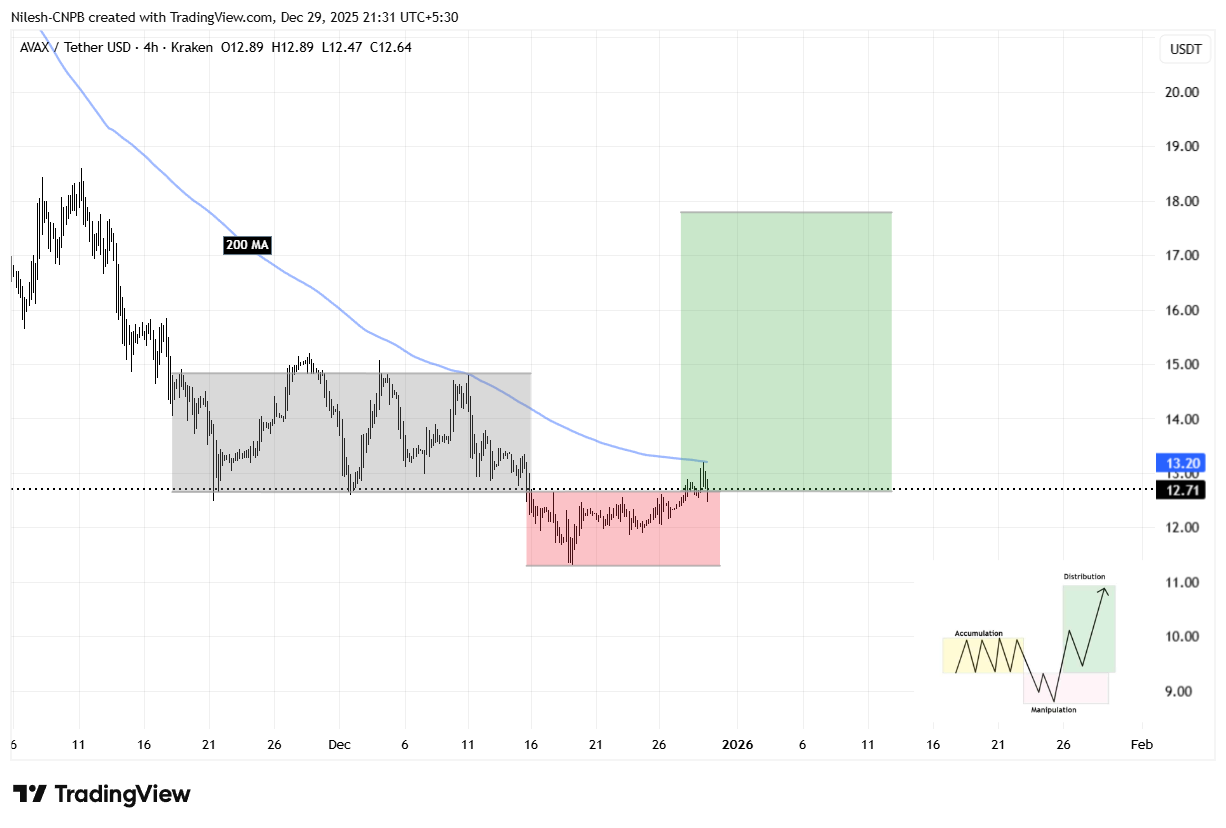
Avalanche (AVAX) 4H Chart/Coinsprobe (Source: Tradingview)
Expansion Phase Begins to Unfold
Following the sweep of lows, AVAX rebounded quickly and reclaimed the $12.64 level, signaling that buyers have stepped back in with conviction. This recovery suggests the early stages of the expansion phase may now be underway.
Price is currently pushing toward the 200-hour moving average near $13.20, a level that has consistently acted as dynamic resistance during the broader downtrend. A sustained move above this moving average would represent a meaningful shift in short-term momentum and strengthen the bullish reversal narrative.
What’s Next for AVAX?
If AVAX manages to break and hold above the 200-hour moving average, the next major resistance lies at $14.80 — the upper boundary of the prior accumulation range. A decisive reclaim of this zone would confirm a bullish breakout and likely attract fresh momentum participation.
Based on the Power of 3 structure, a successful breakout could open the door for a measured move toward the $18.29 region, derived from projecting the height of the accumulation range upward from the breakout point. This target aligns closely with the expansion zone highlighted on the chart.
That said, caution remains necessary. A failure to hold above $12.64 would weaken the expansion thesis and could force AVAX back into consolidation, delaying any meaningful upside continuation.
For now, AVAX sits at a technically critical inflection point. The structure suggests that smart money positioning may already be in progress, with the coming sessions likely to determine whether the expansion phase fully materializes.
Disclaimer: The views and analysis presented in this article are for informational purposes only and reflect the author’s perspective, not financial advice. Technical patterns and indicators discussed are subject to market volatility and may or may not yield the anticipated results. Investors are advised to exercise caution, conduct independent research, and make decisions aligned with their individual risk tolerance.
About Author: Nilesh Hembade is the Founder and Lead Author of Coinsprobe, with over 5 years of experience in the cryptocurrency and blockchain industry. Since launching Coinsprobe in 2023, he has been providing daily, research-driven insights through in-depth market analysis, on-chain data, and technical research.
Disclaimer: The information on this page may come from third parties and does not represent the views or opinions of Gate. The content displayed on this page is for reference only and does not constitute any financial, investment, or legal advice. Gate does not guarantee the accuracy or completeness of the information and shall not be liable for any losses arising from the use of this information. Virtual asset investments carry high risks and are subject to significant price volatility. You may lose all of your invested principal. Please fully understand the relevant risks and make prudent decisions based on your own financial situation and risk tolerance. For details, please refer to
Disclaimer.
Related Articles
Iran–U.S. war ceasefire for 2 weeks! Bitcoin surges to 72k, TSMC jumps sharply—but we still can’t be too optimistic
Pakistan helped broker a two-week ceasefire agreement between the U.S. and Iran, easing market tensions, leading Bitcoin’s price to break above $72,000 and triggering liquidations of approximately $600 million in cryptocurrency futures. Oil prices plunged 13%, and traditional financial markets also rebounded on expectations of peace. Although the market has risen temporarily, it still needs to watch the progress of negotiations over the next two weeks, because the core issues have not been resolved and future volatility risk remains.
CryptoCity28m ago
New 6-week high! Bitcoin ETFs pulled in $470 million, analysts say: a breakout setup is brewing
U.S. spot Bitcoin ETFs pulled in $471 million on Monday, setting a six-week high, indicating that institutional investor confidence is rebounding. Despite the strong inflows, geopolitical and economic uncertainties may still affect the uptrend. Analysts say that if key macroeconomic variables improve, the crypto market could see upward momentum again.
CryptoCity30m ago
Altcoin Momentum Builds as EDGE, VVV, and ALGO Turn Bullish
EDGE surged 86%, consolidating above $0.90, with upside toward $1.50 if momentum continues.
VVV forms a bull flag near $7.2, breakout could push price toward $10–$12.
ALGO gained 48%, confirming trend reversal, next resistance sits between $0.20 and $0.23.
Altcoin activity continues to p
CryptoNewsLand36m ago
JPMorgan: Digital asset inflows of $11 billion in Q1 2026, with Strategy as the primary buyer
A JPMorgan report shows that in Q1 2026, digital-asset inflows were about $11 billion, mainly coming from Bitcoin purchases. The overall crypto market is down 20%; positions in CME futures for Bitcoin and ETH have weakened, with capital concentrating into a small number of large exchanges, suggesting that investors are cautious.
GateNews2h ago
Cardano Prints Bullish Double Bottom Pattern, $5 ADA ATH Expected as Most Altcoin Charts Remain Strong
Cardano prints bullish double bottom pattern.
$5 ADA ATH price could be hit this year.
Most altcoin price charts remain strong, signaling bull pumps ahead.
The crypto community continues to watch several altocin price charts to mange their expectations for a bullish altseason peak
CryptoNewsLand2h ago
Analyst Says the Lower XRP Goes the More Bullish the Breakout as Experts Remain Unsure About XRP Recovery
Analyst says the lower XRP goes the more bullish the breakout.
Other experts remain unsure about an XRP recovery.
Can the price of XRP set a new ATH this year?
The crypto market sees renewed hope and improved anticipation of a bullish recovery rally as the price of BTC just reclaimed pri
CryptoNewsLand3h ago
