 HBAR hasn’t given traders much to get excited about for a while, but that quiet stretch may finally be coming to an end.
Trader Lucky recently said that “$HBAR looks obvious for a new wave”, and when you look at the chart, it’s easy to see why that comment is catching attention.
After months of grinding lower, price is now sitting at a level where the balance between buyers and sellers feels different. It’s not explosive yet, but the pressure that’s been weighing on HBAR for most of 2025 is starting to ease.
HBAR hasn’t given traders much to get excited about for a while, but that quiet stretch may finally be coming to an end.
Trader Lucky recently said that “$HBAR looks obvious for a new wave”, and when you look at the chart, it’s easy to see why that comment is catching attention.
After months of grinding lower, price is now sitting at a level where the balance between buyers and sellers feels different. It’s not explosive yet, but the pressure that’s been weighing on HBAR for most of 2025 is starting to ease.
- The HBAR Downtrend Is Losing Its Grip
- Fundamentals Haven’t Gone Quiet
- Why This Zone Is So Important for Hedera
The HBAR Downtrend Is Losing Its Grip
If you zoom out on the daily chart, HBAR has spent a long time moving inside a descending channel. Every bounce failed, every rally got sold, and the trend stayed firmly pointed down.
What’s changed is where the HABR price is now. Since October, HBAR has repeatedly found support in the $0.10–$0.11 zone. Each time sellers tried to push it lower, buyers stepped in. That kind of repeated defense often shows up when selling pressure starts to dry up.
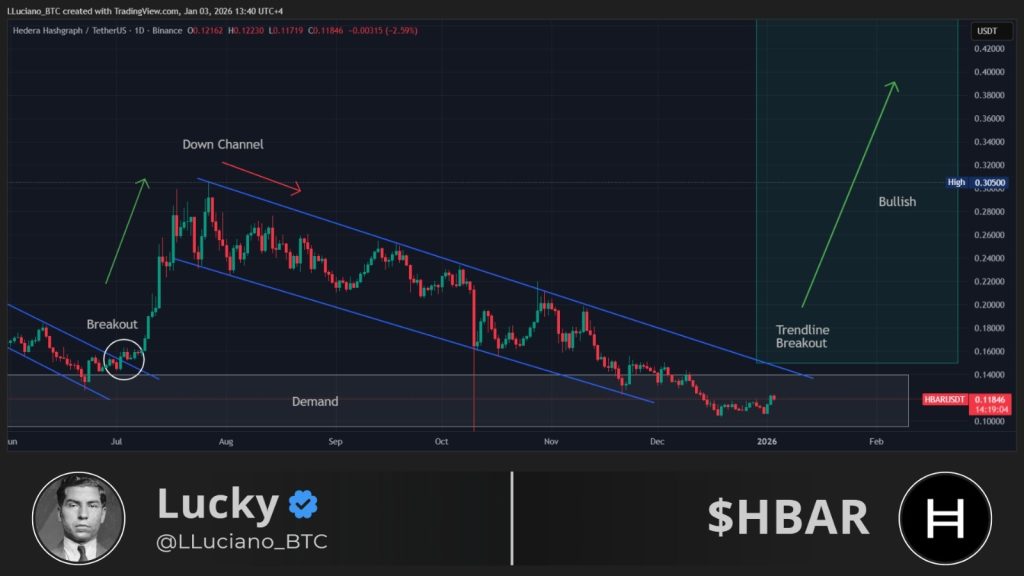
Source: X/@LLuciano_BTC
Lucky’s chart points to a potential break above the upper trendline of that channel. If the price can get through that area and stay there, it would mark the first real structural shift HBAR has seen in months. That’s usually how longer corrections start to unwind.
Fundamentals Haven’t Gone Quiet
While price action has been dull, Hedera itself hasn’t slowed down. The governing council already includes companies like Google, IBM, and Deutsche Telekom, and plans are in place to add more members in 2026. Each new council member brings real network usage, which directly ties into HBAR demand.
Transaction activity has continued to grow quietly, with the network passing 71 billion transactions by the end of 2025. Stablecoins, real-world asset tokenization, and enterprise-focused tools have kept development moving even while the market was weak.
That kind of steady progress matters, especially when prices are low and expectations are muted.
Read Also: How High Can Hedera (HBAR) Price Go in January 2026?
Why This Zone Is So Important for Hedera
Right now, the $0.10–$0.12 area is doing a lot of the heavy lifting. As long as the HBAR price holds above that range, the base stays intact and the recovery narrative remains alive. A clean move above $0.12 would shift momentum further and bring higher levels back into view.
If support fails, it likely means more patience is needed. For now, though, HBAR is doing something it hasn’t done in a long time. It’s quietly giving the market a reason to start watching again.
Disclaimer: The information on this page may come from third parties and does not represent the views or opinions of Gate. The content displayed on this page is for reference only and does not constitute any financial, investment, or legal advice. Gate does not guarantee the accuracy or completeness of the information and shall not be liable for any losses arising from the use of this information. Virtual asset investments carry high risks and are subject to significant price volatility. You may lose all of your invested principal. Please fully understand the relevant risks and make prudent decisions based on your own financial situation and risk tolerance. For details, please refer to
Disclaimer.
Related Articles
BTC drops 1.03% in 15 minutes: tighter macro liquidity and derivatives synchronized to amplify sell-off pressure
From 23:30 to 23:45 (UTC) on 2026-04-07, the BTC price rapidly fell within 15 minutes, with a return of -1.03%. The price range was 71,905.7 to 72,760.5 USDT, and the amplitude was 1.17%. Market attention remained high; intraday volatility significantly increased. Trading volumes across major platforms briefly surged, indicating that selling pressure and risk-avoidance sentiment had permeated mainstream cryptocurrencies.
The main drivers of this deviation were the continued tightening of macro liquidity under the Fed’s hawkish signals and a concentrated adjustment in the BTC derivatives market. The Fed’s interest rate in March 2026
GateNews21m ago
Peter Schiff Challenges Michael Saylor as Bitcoin Debate Heats Up
Peter Schiff and Michael Saylor recently debated Bitcoin's performance, with Schiff arguing it underperformed gold and equities over five years, while Saylor highlighted shorter-term gains. Their dispute illustrates the complexity of data selection in assessing investment viability.
CryptoFrontNews33m ago
BTC 15-minute surge of 1.07%: On-chain activity spikes and ETF fund inflows synchronize to drive the move
2026-04-07 22:45 to 2026-04-07 23:00 (UTC), the BTC price recorded a +1.07% return. The price range was 70,733.5 to 71,518.9 USDT, with a 1.11% amplitude. Short-term volatility intensified, drawing strong market attention. On-chain data shows the number of active addresses rose to 38,971, up 5.2% from the previous hour. The total number of addresses added approximately 252,780 within an hour; network activity and new user growth increased significantly, becoming the incremental market momentum behind the unusual move. Spot trading volume reached 11
GateNews1h ago
ETH 15-minute increase of 0.64%: Short-term capital inflows and sentiment shifts drive price fluctuations
2026-04-07 22:00 to 22:15 (UTC), the ETH price ranged between 2145.02 and 2165.83 USDT, and the 15-minute candlestick return reached +0.64%, with a trading range (amplitude) of 0.97%. Market volatility increased and attention rose, indicating short-term activity driven by rapid capital flows.
The main driving force behind this unusual move is that, in the short term, some funds flowed into ETH. Investors are focusing on ETH mainnet assets, and buying interest increased, pushing spot prices higher. At the same time, DeFi and stablecoin-related trading remained active, boosting on-chain liquidity and helping to support a
GateNews1h ago
BTC 15-minute jump of 0.52%: institutional capital inflows and derivatives leverage driving market upside
2026-04-07 22:00 to 2026-04-07 22:15 (UTC), BTC recorded a 15-minute K-line return of +0.52%, with a trading range of 69,919.3 to 70,561.1 USDT and a swing of 0.92%. This bout of abnormal movement occurred against the backdrop of BTC breaking through the $70,000 level, rising market attention, and heightened short-term volatility.
The main driving force behind this abnormal move was the inflow of large-scale institutional funds and a synchronized buy-side response tied to ETFs. Among them, an ETF product under a global asset management giant transferred 1,1
GateNews1h ago
XRP Stabilizes Near Key Levels Amid Fed Pressure and Rule Shift
Key Insights
XRP stabilized near $1.31 as macroeconomic pressures and declining liquidity combined to limit recovery momentum and increase short-term volatility risks significantly.
Proposed stablecoin regulations favor utility models, positioning RLUSD for growth while reducing incentives t
CryptoNewsLand2h ago
