Date: Wed, Dec 31, 2025 | 03:40 PM GMT
As the final hours of 2025 approach, the broader cryptocurrency market is showing modest strength. Both Bitcoin (BTC) and Ethereum (ETH) are trading slightly in the green, helping ease recent volatility and stabilize overall market sentiment. This calmer environment has allowed select altcoins — including Plasma (XPL) — to begin forming constructive technical setups after extended periods of downside pressure.
XPL is starting to attract attention with an impressive 11% daily jump, trimming its 60-day decline to roughly 43%. While the broader trend still reflects recovery mode, the more important signal is emerging on the daily chart, where price action is beginning to suggest a meaningful structural shift. If confirmed, this setup could mark the early stages of a bullish continuation heading into the new year.

Source: Coinmarketcap
Rounding Bottom in Play
On the daily timeframe, XPL appears to be forming a textbook rounding bottom pattern — a classic bullish reversal structure that typically develops after a prolonged downtrend. This pattern reflects a slow but steady transition from selling dominance to accumulation, as bearish momentum fades and buyers gradually regain control.
Earlier in the trend, XPL faced strong rejection near the $0.3321 neckline zone, triggering a sharp decline that extended through November and December. That sell-off ultimately found a floor near the $0.1152 level, which has since proven to be a critical demand zone. Repeated defenses of this area prevented further downside and laid the foundation for a potential trend reversal.
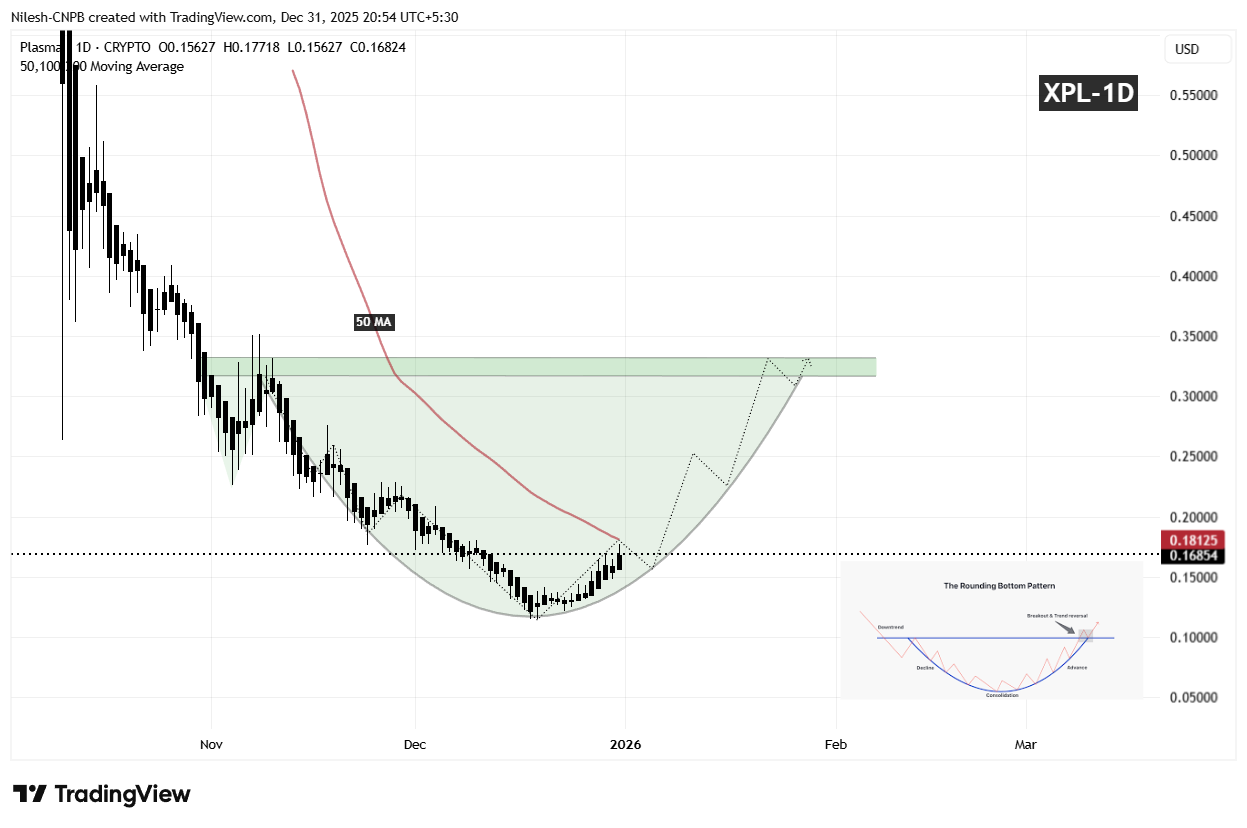
XPL Daily Chart/Coinsprobe (Source: Tradingview)
Since establishing that base, XPL has begun to curve higher in a rounded fashion, mirroring the classic structure of a developing bottom. This gradual recovery suggests that selling pressure is no longer aggressive, and that accumulation is taking place beneath the surface. The recent push back above the $0.16 region further reinforces the idea that buyers are positioning ahead of a larger directional move.
What’s Next for XPL?
For the rounding bottom pattern to gain confirmation, XPL needs to reclaim the 50-day moving average, currently positioned near the $0.1812 level. A sustained move above this area would signal a clear momentum shift and indicate that bulls are regaining control after months of corrective price action.
Looking higher, the most significant technical barrier remains the neckline resistance around $0.3321, highlighted by the prior distribution zone on the chart. A clean breakout above this region would validate the entire reversal structure and could open the door for a broader bullish expansion phase, with momentum traders and sidelined participants likely re-entering the market.
Until those levels are reclaimed, the pattern remains in its development phase. Short-term consolidation or minor pullbacks remain possible if price struggles near the 50-day moving average. However, as long as XPL continues to hold higher lows above the $0.1152 base, the broader bottoming structure remains intact.
Overall, XPL is approaching a technically important inflection point. The emerging rounding bottom formation, improving price structure, and proximity to key resistance levels suggest the coming sessions could prove decisive for Plasma’s next major directional move as the market transitions into 2026.
Disclaimer: The views and analysis presented in this article are for informational purposes only and reflect the author’s perspective, not financial advice. Technical patterns and indicators discussed are subject to market volatility and may or may not yield the anticipated results. Investors are advised to exercise caution, conduct independent research, and make decisions aligned with their individual risk tolerance.
About Author: Nilesh Hembade is the Founder and Lead Author of Coinsprobe, with over 5 years of experience in the cryptocurrency and blockchain industry. Since launching Coinsprobe in 2023, he has been providing daily, research-driven insights through in-depth market analysis, on-chain data, and technical research.

Disclaimer: The information on this page may come from third parties and does not represent the views or opinions of Gate. The content displayed on this page is for reference only and does not constitute any financial, investment, or legal advice. Gate does not guarantee the accuracy or completeness of the information and shall not be liable for any losses arising from the use of this information. Virtual asset investments carry high risks and are subject to significant price volatility. You may lose all of your invested principal. Please fully understand the relevant risks and make prudent decisions based on your own financial situation and risk tolerance. For details, please refer to
Disclaimer.
Related Articles
SPX (Prophecy) rose 11.09% in the past 24 hours
Gate News, April 8, according to Gate Market data, as of the time of publication, SPX (motto) is trading at $0.31. It is up 11.09% over the past 24 hours, with a high of $0.32 and a low of $0.27. The 24-hour trading volume reached $467.8k. The current market cap is approximately $287 million.
SPX6900 is a worthless meme crypto token that parodies traditional finance (especially the S&P 500 index), while encouraging people to abandon financial nihilism and “believe in something.” The total supply of SPX tokens is 1 billion, with a circulating supply of approximately 931 million and 6.9% already burned. The coin uses multi-chain deployment and supports multiple blockchain networks such as Ethereum, Solana, and Base.
GateNews3m ago
Why is Bitcoin up today? Iran agrees to a two-week ceasefire, and Iran-U.S. negotiations will begin
U.S. President Trump announced a pause in military action against Iran. Iran accepted the ceasefire proposal, and Bitcoin surged nearly 3% in response. This ceasefire was brokered by Pakistan and will take effect on April 8, helping to ease uncertainty in global energy markets. The durability of the ceasefire still depends on the outcome of further negotiations.
MarketWhisper18m ago
The Crypto Fear and Greed Index rose to 17 today, and the market remains in a state of extreme fear
Gate News message: On April 8, according to Alternative.me data, the crypto Fear and Greed Index rose to 17 today, up from 11 yesterday (April 7), but the market overall is still in a state of “extreme fear.”
GateNews44m ago
Bitcoin reclaims $72K after US, Iran agree to 2-week ceasefire
Bitcoin surged past $72,000 after a two-week ceasefire between the US and Iran was announced. Traders often react positively to eased geopolitical tensions, despite overall market fear.
Cointelegraph45m ago
BTC drops 1.03% in 15 minutes: tighter macro liquidity and derivatives synchronized to amplify sell-off pressure
From 23:30 to 23:45 (UTC) on 2026-04-07, the BTC price rapidly fell within 15 minutes, with a return of -1.03%. The price range was 71,905.7 to 72,760.5 USDT, and the amplitude was 1.17%. Market attention remained high; intraday volatility significantly increased. Trading volumes across major platforms briefly surged, indicating that selling pressure and risk-avoidance sentiment had permeated mainstream cryptocurrencies.
The main drivers of this deviation were the continued tightening of macro liquidity under the Fed’s hawkish signals and a concentrated adjustment in the BTC derivatives market. The Fed’s interest rate in March 2026
GateNews1h ago
Peter Schiff Challenges Michael Saylor as Bitcoin Debate Heats Up
Peter Schiff and Michael Saylor recently debated Bitcoin's performance, with Schiff arguing it underperformed gold and equities over five years, while Saylor highlighted shorter-term gains. Their dispute illustrates the complexity of data selection in assessing investment viability.
CryptoFrontNews1h ago
