
Date: Sat, Dec 27, 2025 | 05:59 AM GMT
**Gold **prices have officially surged to fresh all-time highs, breaking above the $4,550 mark and printing a peak near $4,553 on December 26, 2025. This historic move caps off an exceptional year for the yellow metal, which is now up more than 73% in 2025 and currently trading around $4,538.
In contrast, Bitcoin (BTC), often referred to as “digital gold,” continues to lag behind. Despite several recovery attempts, BTC remains down more than 6% on the year, significantly underperforming gold and leaving many investors questioning whether Bitcoin’s next major move is still ahead.
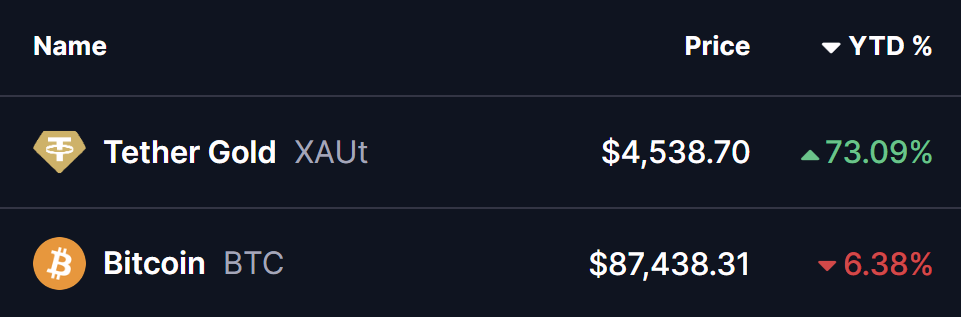
Source: Coinmarketcap
While gold’s explosive rally dominates headlines, a growing number of market participants are paying attention to a quieter but potentially more important development: Bitcoin’s price structure is beginning to resemble gold’s historical setup before its own breakout. Historically, Bitcoin has rarely moved in perfect sync with gold. Instead, it has often followed with a delay, reacting only after gold establishes a clear directional trend.
Historical Gold Fractal Hints at Bullish Potential
The latest chart comparison shared by analyst Crypto Tice highlights a striking fractal between Bitcoin’s current structure and gold’s price behavior during its 2023 bottoming phase.
Back then, gold spent an extended period trapped between rising support and overhead resistance. The market endured repeated rejections from a descending trendline, while buyers consistently stepped in at higher lows. This prolonged consolidation tested investor patience and created widespread uncertainty about whether gold could ever escape its range.
That phase ultimately turned out to be accumulation rather than distribution. Once gold successfully broke above its resistance trendline, the move triggered a powerful upside expansion, setting the stage for the historic rally that followed.
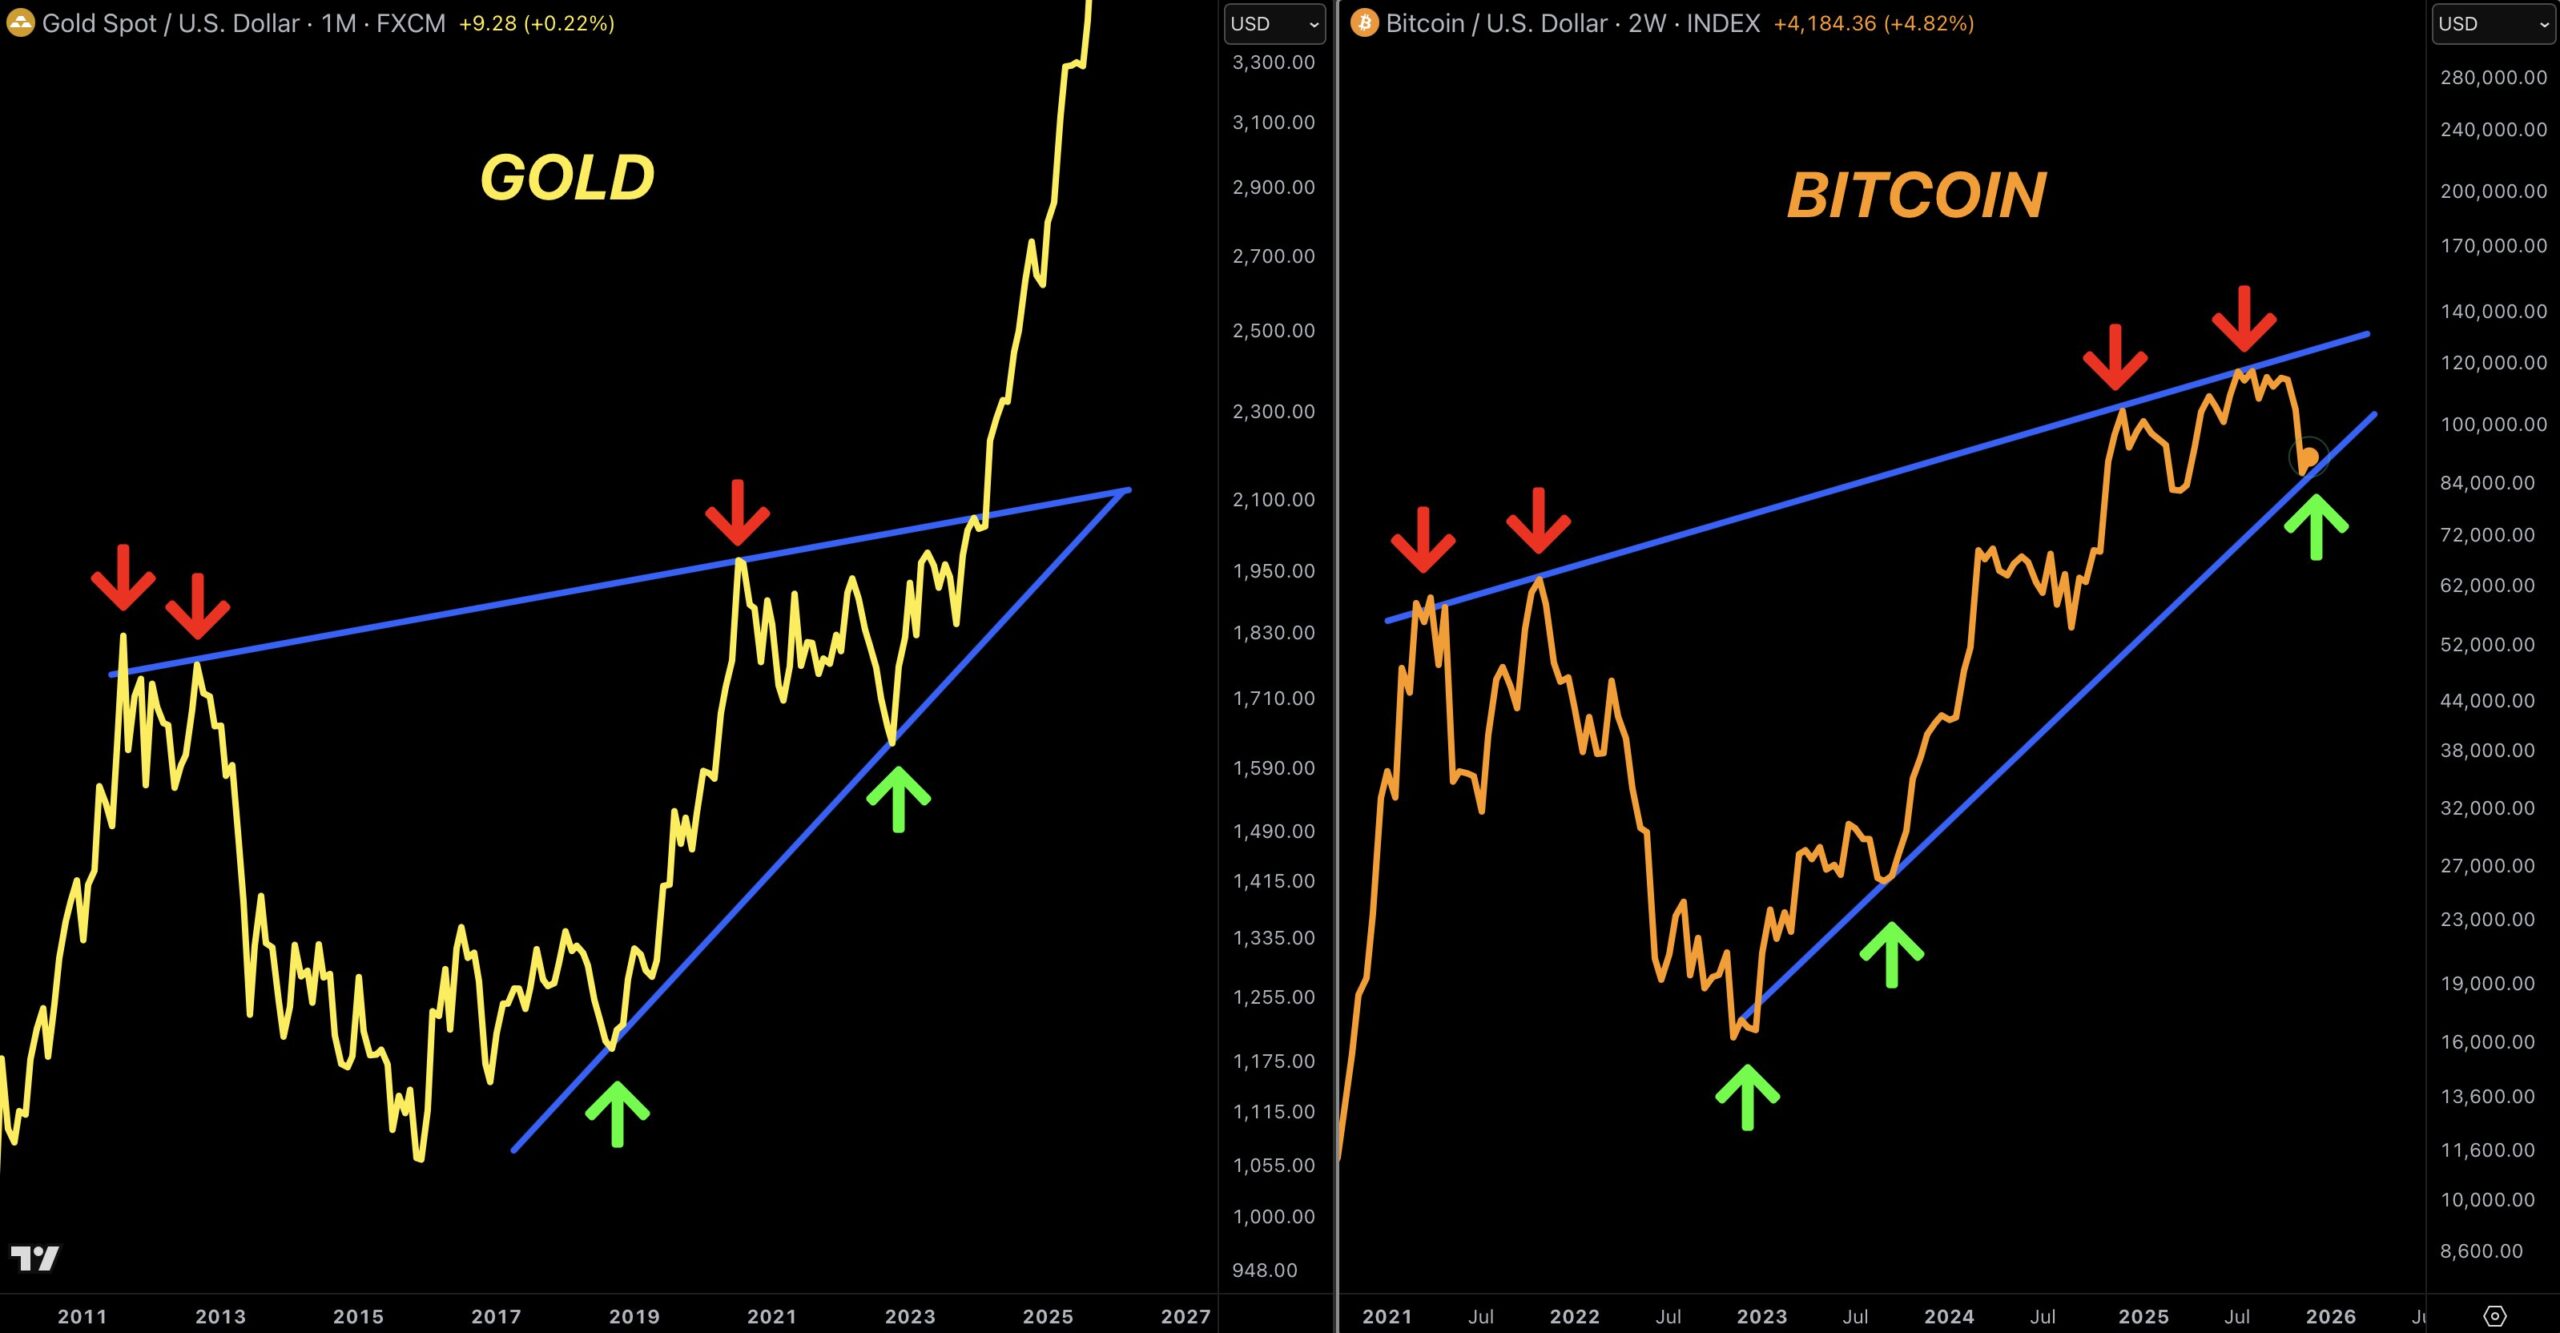
GOLD and BTC Fractal Chart/Credits: @CryptoTice(X)_
Bitcoin’s current chart shows a remarkably similar structure. The rejection from the $120,000–$126,000 region mirrors gold’s earlier failed breakout attempts, while BTC’s ongoing consolidation between roughly $80,000 and $90,000 reflects the same grinding base-building behavior gold displayed before its surge. In both cases, price action has been defined by compressed volatility, repeated support tests, and pressure from a rising resistance line that has not yet been convincingly cleared.
What’s Next for BTC?
If this gold-to-Bitcoin fractal continues to play out, Bitcoin’s current sideways movement may represent the final phase of accumulation before a renewed bullish leg. A decisive breakout above the ascending resistance trendline could act as a major sentiment shift, potentially opening the door for a powerful trend continuation toward much higher levels, with long-term targets above $200,000 coming back into focus.
That said, fractals are not guarantees. They provide historical context, not certainty. For the bullish scenario to remain valid, Bitcoin must continue to defend the critical $80,000–$85,000 support zone. A sustained breakdown below this region would weaken the fractal comparison and suggest that BTC needs more time before any meaningful upside can unfold.
For now, gold’s record-breaking rally serves as a reminder that long consolidations often resolve sharply once conditions align. If Bitcoin continues to echo gold’s historical path, the current period of calm could be setting the stage for its next major move.
Disclaimer: The views and analysis presented in this article are for informational purposes only and reflect the author’s perspective, not financial advice. Technical patterns and indicators discussed are subject to market volatility and may or may not yield the anticipated results. Investors are advised to exercise caution, conduct independent research, and make decisions aligned with their individual risk tolerance.
Disclaimer: The information on this page may come from third parties and does not represent the views or opinions of Gate. The content displayed on this page is for reference only and does not constitute any financial, investment, or legal advice. Gate does not guarantee the accuracy or completeness of the information and shall not be liable for any losses arising from the use of this information. Virtual asset investments carry high risks and are subject to significant price volatility. You may lose all of your invested principal. Please fully understand the relevant risks and make prudent decisions based on your own financial situation and risk tolerance. For details, please refer to
Disclaimer.
Related Articles
Solo Bitcoin Miner Wins $210K Block Reward Against Huge Odds
A solo Bitcoin miner has achieved something that most people in the crypto space consider nearly impossible today. The miner successfully validated a block and secured a reward worth around $210,000. This win came despite facing extremely low probability odds, estimated at roughly 1 in 28,000. In a
Coinfomania1m ago
BTC profit/loss trade ratio is 2.95, the highest level in 12 weeks
Gate News message: On April 6, according to Santiment data, the BTC profit-loss trade ratio reached 2.95, the highest level in 12 weeks. This indicator measures the ratio of profitable trades to losing trades; the current value shows that the share of profitable trades in the market is significantly higher than that of losing trades, reaching a recent peak level.
GateNews20m ago
BTC 15-minute pullback of 0.66%: Trade policy shock combined with large holders selling off triggers downside pressure
From 06:15 to 06:30 (UTC) on 2026-04-06, the BTC price dropped from 68807.2 to 69308.1 USDT; the 15-minute return recorded -0.66%, and the amplitude reached 0.72%. During this period, market volatility intensified, with trading volume and social discussion heat increasing in tandem, reflecting intense short-term capital games.
The main driving force behind this abnormal movement came from sudden changes at the macro policy level. The United States has recently increased tariffs and continued its high-tariff policy, causing a sharp drop in global risk appetite and prompting investors to withdraw en masse from high-volatility assets. Related con
GateNews1h ago
Bitcoin meltdown to $10,000 remains likely unless prices reclaim $75,000, analyst says
A familiar voice is back with a familiar, and controversial, call on bitcoin BTC$66,860.50.
Mike McGlone, senior commodity strategist for Bloomberg Intelligence, is reiterating that bitcoin could crash to $10,000.
But this time, he's framed it with a very clear line in the sand: $75,000.
If bitco
CoinDesk3h ago
