
Date: Mon, Dec 29, 2025 | 08:30 AM GMT
The broader cryptocurrency market has kicked off the final week of 2025 on a constructive note, with both Bitcoin (BTC) and Ethereum (ETH) posting gains of over 2%. This steady strength among major assets has helped stabilize market sentiment, creating room for select altcoins — including Sui (SUI) — to develop promising technical structures.
SUI is trading with a modest intraday gain, but more importantly, its price action is beginning to reflect a clear structural shift. The chart suggests that selling pressure is fading and that a potential bullish continuation phase may be forming beneath the surface.
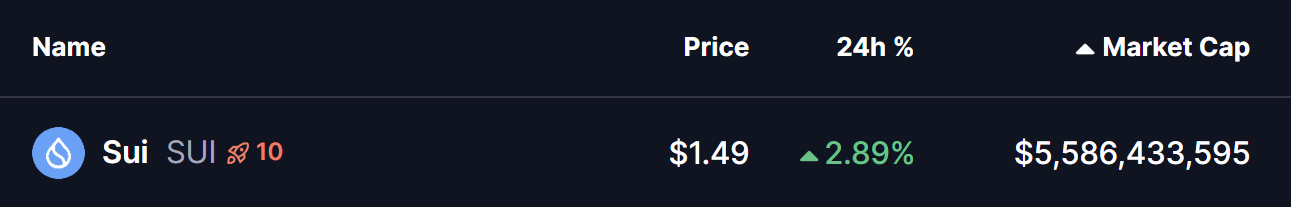
Source: Coinmarketcap
Bearish Bat Pattern in Play?
On the 4-hour timeframe, SUI appears to be carving out a Bearish Bat harmonic pattern. Despite its name, this structure often allows for an upside move toward the completion point before any broader trend decision takes place.
The formation started from Point X near the $1.728 area, followed by a sharp decline into Point A. Price then staged a recovery toward Point B before undergoing a deeper corrective move into Point C around $1.35. This region acted as a strong demand zone, where buyers consistently stepped in to absorb selling pressure.
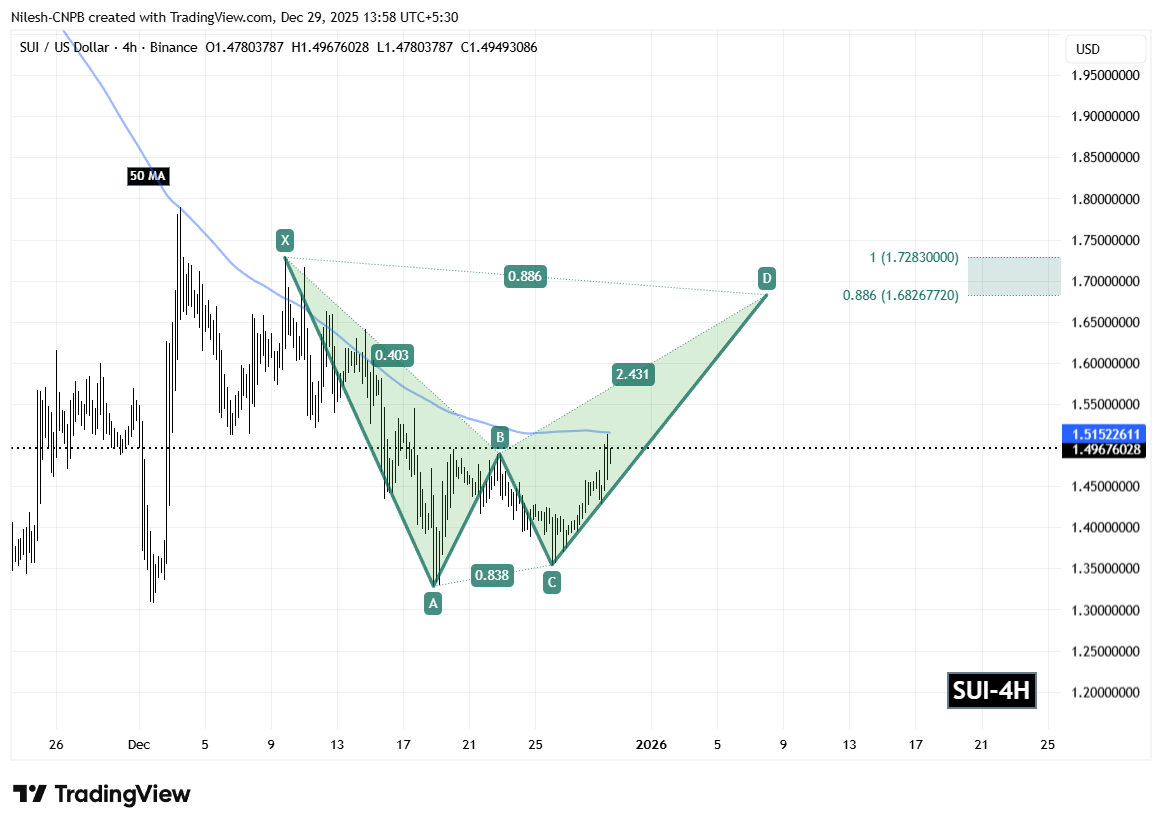
Sui (SUI) 4H Chart/Coinsprobe (Source: Tradingview)
Since printing the Point C low, SUI has shown steady recovery behavior and is currently trading around the $1.49 level. This rebound highlights waning bearish momentum and growing buyer confidence at lower prices.
Adding further technical weight to the setup, the 50-period moving average on the 4-hour chart is positioned near $1.51. A decisive reclaim and sustained hold above this level would reinforce bullish momentum and validate the ongoing recovery structure.
What’s Next for SUI?
If buyers continue to defend the $1.43 support zone and successfully flip the 50-hour moving average into support, the harmonic structure suggests a continuation move toward the Potential Reversal Zone (PRZ).
Based on Fibonacci projections, the PRZ lies between $1.6826 (0.886 extension) and $1.7283 (1.0 extension). This zone represents a potential upside of roughly 15% from current levels and aligns closely with classic harmonic completion targets, where price reactions often intensify.
For now, SUI’s technical outlook remains constructive. As long as support holds and momentum continues to build, the harmonic pattern indicates that the next meaningful move may favor the upside, positioning SUI for a test of higher resistance zones in the sessions ahead.
Disclaimer
The views and analysis presented in this article are for informational purposes only and reflect the author’s perspective, not financial advice. Technical patterns and indicators discussed are subject to market volatility and may or may not yield the anticipated results. Investors are advised to exercise caution, conduct independent research, and make decisions aligned with their individual risk tolerance.
About Author
Nilesh Hembade is the Founder and Lead Author of Coinsprobe, with over 5 years of experience in the cryptocurrency and blockchain industry. Since launching Coinsprobe in 2023, he has been providing daily, research-driven insights through in-depth market analysis, on-chain data, and technical research.

Disclaimer: The information on this page may come from third parties and does not represent the views or opinions of Gate. The content displayed on this page is for reference only and does not constitute any financial, investment, or legal advice. Gate does not guarantee the accuracy or completeness of the information and shall not be liable for any losses arising from the use of this information. Virtual asset investments carry high risks and are subject to significant price volatility. You may lose all of your invested principal. Please fully understand the relevant risks and make prudent decisions based on your own financial situation and risk tolerance. For details, please refer to
Disclaimer.
Related Articles
ATOM Eyes 15% Gain: Technical Indicators Point to Possible Upswing
ATOM broke a long bearish trend with a 5.25% price increase.
Price must close above $1.77 to confirm a potential 15% rally.
Top holders and rising Open Interest indicate growing bullish sentiment among traders.
Cosmos — ATOM, has started showing signs of breaking free from a long bearish
CryptoNewsLand29m ago
Bitcoin’s implied volatility drops to an intra-year low, and the market is reacting mildly to Friday’s CPI data
April 9, U.S. March CPI data will be released on April 11. The market expects the year-over-year rate to rise from 2.4% to 3.4%. The Bitcoin market has responded calmly, with the options market’s volatility range only at 2.5%. Attention has been drawn by the rise in gasoline prices. Analysts believe that CPI data coming in either too soft or too hot will have different impacts on the crypto market.
GateNews1h ago
XRP Stabilizes Near Key Levels Amid Fed Pressure and Rule Shift
Key Insights
XRP stabilized near $1.31 as macroeconomic pressures and declining liquidity combined to limit recovery momentum and increase short-term volatility risks significantly.
Proposed stablecoin regulations favor utility models, positioning RLUSD for growth while reducing incentives t
CryptoNewsLand1h ago
XRP Today’s News: Institutional funds return, circulating inflow of 120 million exceeds Bitcoin
This week, XRP recorded a $119.6 million capital inflow, setting the highest mark since 2025 and becoming a major beneficiary in the crypto market. This round of funds returning was mainly driven by greater clarity in regulatory policy and XRP’s real-world use in cross-border payment infrastructure. Technically, it shows an initial recovery, but overall it is still in a downward channel. The support and resistance levels are $1.31 and $1.40, respectively; if it breaks through, it is expected to reach $1.50.
MarketWhisper4h ago
XRP drops to $1.33, with $3.32 million in ETF inflows still failing to reverse the downtrend; the key support to watch is $1.28
In April 2026, the XRP price pulled back to $1.33, down about 4%. Although there was capital inflow into Ripple-related products, selling pressure dominated the market, and increased trading volume signaled distribution. Declining liquidity further heightens volatility risk; watch the $1.33 support—if it breaks, prices will likely fall further. For a short-term rebound, it needs to break above $1.35; otherwise, it should remain in a weak range-bound consolidation.
GateNews4h ago
XRP Price Structure Signals More Downside — Key Levels to Watch
XRP fails to make new highs, confirming bearish market structure remains intact.
Price targets $1.13, $1.08, and potentially $0.87 support levels.
Traders should wait for confirmation instead of reacting to short-term price moves.
Short bursts of green candles can quickly shift market
CryptoNewsLand4h ago
