 Crypto trader Don, also known as DonWedge, is pushing back against the growing urge to give up on altcoins. His warning comes as charts show altcoins sitting at a point that has historically mattered more than it looks at first glance.
At the center of his view is a long-term chart tracking the total crypto market cap excluding the top 10 assets. This metric is often used to gauge the health of the broader altcoin market without Bitcoin and a few large names skewing the data.
What the Altcoin chart is showing
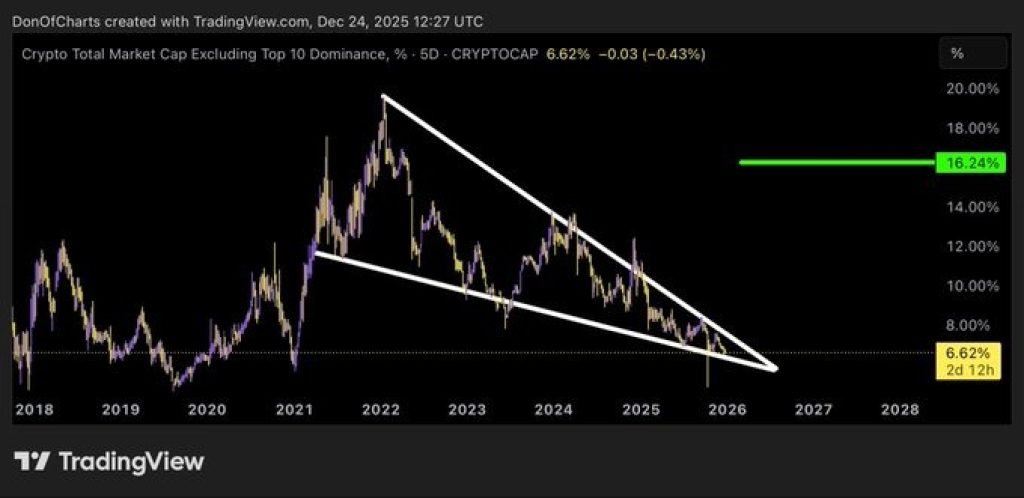
The chart stretches back to 2018 and highlights a long descending structure. Altcoins have been making lower highs for years, compressing into a narrowing wedge. That compression is now reaching its final stage, with price squeezed into the tip of the pattern.
This kind of structure usually signals that the market is running out of room. Volatility dries up, sentiment turns negative, and most participants lose interest.
That is exactly where the Altcoin chart sits now. The current reading is near 6.6%, a level that reflects how small altcoins have been pushed into a corner after years of underperformance.
What stands out is the projected upside marked on the chart. If the wedge breaks upward, the move targets the 16% zone. That would represent a major shift in relative strength back toward altcoins, similar to what happened after previous long periods of compression.
Crypto trader Don, also known as DonWedge, is pushing back against the growing urge to give up on altcoins. His warning comes as charts show altcoins sitting at a point that has historically mattered more than it looks at first glance.
At the center of his view is a long-term chart tracking the total crypto market cap excluding the top 10 assets. This metric is often used to gauge the health of the broader altcoin market without Bitcoin and a few large names skewing the data.
What the Altcoin chart is showing
The chart stretches back to 2018 and highlights a long descending structure. Altcoins have been making lower highs for years, compressing into a narrowing wedge. That compression is now reaching its final stage, with price squeezed into the tip of the pattern.
This kind of structure usually signals that the market is running out of room. Volatility dries up, sentiment turns negative, and most participants lose interest.
That is exactly where the Altcoin chart sits now. The current reading is near 6.6%, a level that reflects how small altcoins have been pushed into a corner after years of underperformance.
What stands out is the projected upside marked on the chart. If the wedge breaks upward, the move targets the 16% zone. That would represent a major shift in relative strength back toward altcoins, similar to what happened after previous long periods of compression.
Source: X/Don
Why Don says “do NOT sell” Altcoins here
From Don’s perspective, this is not a moment of strength where profits should be locked in. It is a moment of exhaustion. Long-term downtrends often end when most traders feel tired, bored, or convinced nothing will change.
Selling at this point means exiting after years of decline, just as the structure tightens and risk-to-reward starts to flip.
Historically, large altcoin rotations have started when dominance looks weak, not strong. By the time momentum feels obvious again, much of the move is already gone.
_Read Also: _****Here’s the SEI Price If Enterprises Adopt Sei Market Infrastructure Grid
Moreover, sentiment around altcoins is poor. Liquidity is thin, rallies fail quickly, and many traders have already rotated back to Bitcoin or stablecoins.
That emotional backdrop lines up with what the chart suggests: a late-stage compression rather than the start of a new collapse.
This does not guarantee an immediate breakout. These phases can drag on longer than expected. But Don’s point is simple. Selling into compression, after a multi-year downtrend, has historically been the wrong side of the trade.
However, the chart does not argue that every altcoin will win or that prices must explode tomorrow. It shows that the broader altcoin market is nearing a structural decision point. When markets reach this stage, the biggest mistake is often giving up too late.
That is why Don’s message is so direct. In his view, this is the phase where patience matters more than prediction.
Disclaimer: The information on this page may come from third parties and does not represent the views or opinions of Gate. The content displayed on this page is for reference only and does not constitute any financial, investment, or legal advice. Gate does not guarantee the accuracy or completeness of the information and shall not be liable for any losses arising from the use of this information. Virtual asset investments carry high risks and are subject to significant price volatility. You may lose all of your invested principal. Please fully understand the relevant risks and make prudent decisions based on your own financial situation and risk tolerance. For details, please refer to
Disclaimer.
Related Articles
BTC drops 1.03% in 15 minutes: tighter macro liquidity and derivatives synchronized to amplify sell-off pressure
From 23:30 to 23:45 (UTC) on 2026-04-07, the BTC price rapidly fell within 15 minutes, with a return of -1.03%. The price range was 71,905.7 to 72,760.5 USDT, and the amplitude was 1.17%. Market attention remained high; intraday volatility significantly increased. Trading volumes across major platforms briefly surged, indicating that selling pressure and risk-avoidance sentiment had permeated mainstream cryptocurrencies.
The main drivers of this deviation were the continued tightening of macro liquidity under the Fed’s hawkish signals and a concentrated adjustment in the BTC derivatives market. The Fed’s interest rate in March 2026
GateNews37m ago
Peter Schiff Challenges Michael Saylor as Bitcoin Debate Heats Up
Peter Schiff and Michael Saylor recently debated Bitcoin's performance, with Schiff arguing it underperformed gold and equities over five years, while Saylor highlighted shorter-term gains. Their dispute illustrates the complexity of data selection in assessing investment viability.
CryptoFrontNews49m ago
BTC 15-minute surge of 1.07%: On-chain activity spikes and ETF fund inflows synchronize to drive the move
2026-04-07 22:45 to 2026-04-07 23:00 (UTC), the BTC price recorded a +1.07% return. The price range was 70,733.5 to 71,518.9 USDT, with a 1.11% amplitude. Short-term volatility intensified, drawing strong market attention. On-chain data shows the number of active addresses rose to 38,971, up 5.2% from the previous hour. The total number of addresses added approximately 252,780 within an hour; network activity and new user growth increased significantly, becoming the incremental market momentum behind the unusual move. Spot trading volume reached 11
GateNews1h ago
ETH 15-minute increase of 0.64%: Short-term capital inflows and sentiment shifts drive price fluctuations
2026-04-07 22:00 to 22:15 (UTC), the ETH price ranged between 2145.02 and 2165.83 USDT, and the 15-minute candlestick return reached +0.64%, with a trading range (amplitude) of 0.97%. Market volatility increased and attention rose, indicating short-term activity driven by rapid capital flows.
The main driving force behind this unusual move is that, in the short term, some funds flowed into ETH. Investors are focusing on ETH mainnet assets, and buying interest increased, pushing spot prices higher. At the same time, DeFi and stablecoin-related trading remained active, boosting on-chain liquidity and helping to support a
GateNews2h ago
BTC 15-minute jump of 0.52%: institutional capital inflows and derivatives leverage driving market upside
2026-04-07 22:00 to 2026-04-07 22:15 (UTC), BTC recorded a 15-minute K-line return of +0.52%, with a trading range of 69,919.3 to 70,561.1 USDT and a swing of 0.92%. This bout of abnormal movement occurred against the backdrop of BTC breaking through the $70,000 level, rising market attention, and heightened short-term volatility.
The main driving force behind this abnormal move was the inflow of large-scale institutional funds and a synchronized buy-side response tied to ETFs. Among them, an ETF product under a global asset management giant transferred 1,1
GateNews2h ago
XRP Stabilizes Near Key Levels Amid Fed Pressure and Rule Shift
Key Insights
XRP stabilized near $1.31 as macroeconomic pressures and declining liquidity combined to limit recovery momentum and increase short-term volatility risks significantly.
Proposed stablecoin regulations favor utility models, positioning RLUSD for growth while reducing incentives t
CryptoNewsLand2h ago
