Date: Fri, Dec 19 2025 | 12:15 PM GMT
The broader cryptocurrency market has been showing relative strength despite concerns around the Japan rate hike, while easing U.S. inflation has helped both Bitcoin (BTC) and Ethereum (ETH) remain in the green. Against this backdrop, Bitcoin Cash (BCH) has quietly moved into the spotlight, posting a notable upside move.
BCH has climbed nearly 9% recently, but the bigger story appears to be unfolding on the chart itself. Price action is now forming a structure that often precedes larger trend reversals, suggesting that the recent rally may be more than just a short-term bounce.
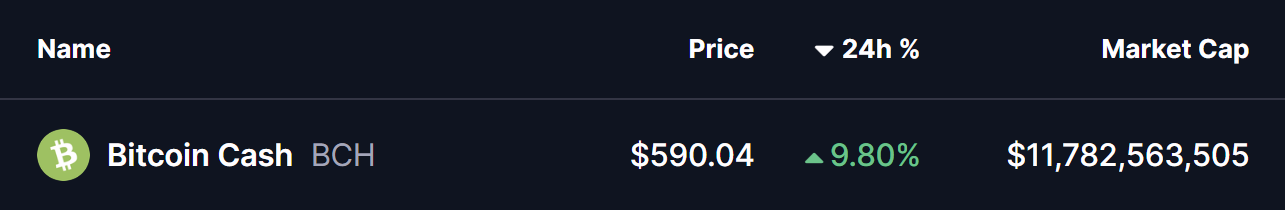
Source: Coinmarketcap
Rounding Bottom in Play?
On the daily timeframe, Bitcoin Cash appears to be carving out a rounding bottom formation — a classic bullish reversal pattern that reflects a gradual shift from distribution to accumulation. This pattern typically develops after a prolonged correction, as selling pressure fades and buyers slowly regain control.
The setup began after BCH faced a firm rejection near the $630 region in September 2025. That rejection triggered a sharp decline, dragging price down toward the $446.9 area. Importantly, sellers failed to push price significantly lower from there, and strong demand emerged at those levels. Over time, BCH stabilized, volatility compressed, and price began to curl higher, completing the rounded base structure.
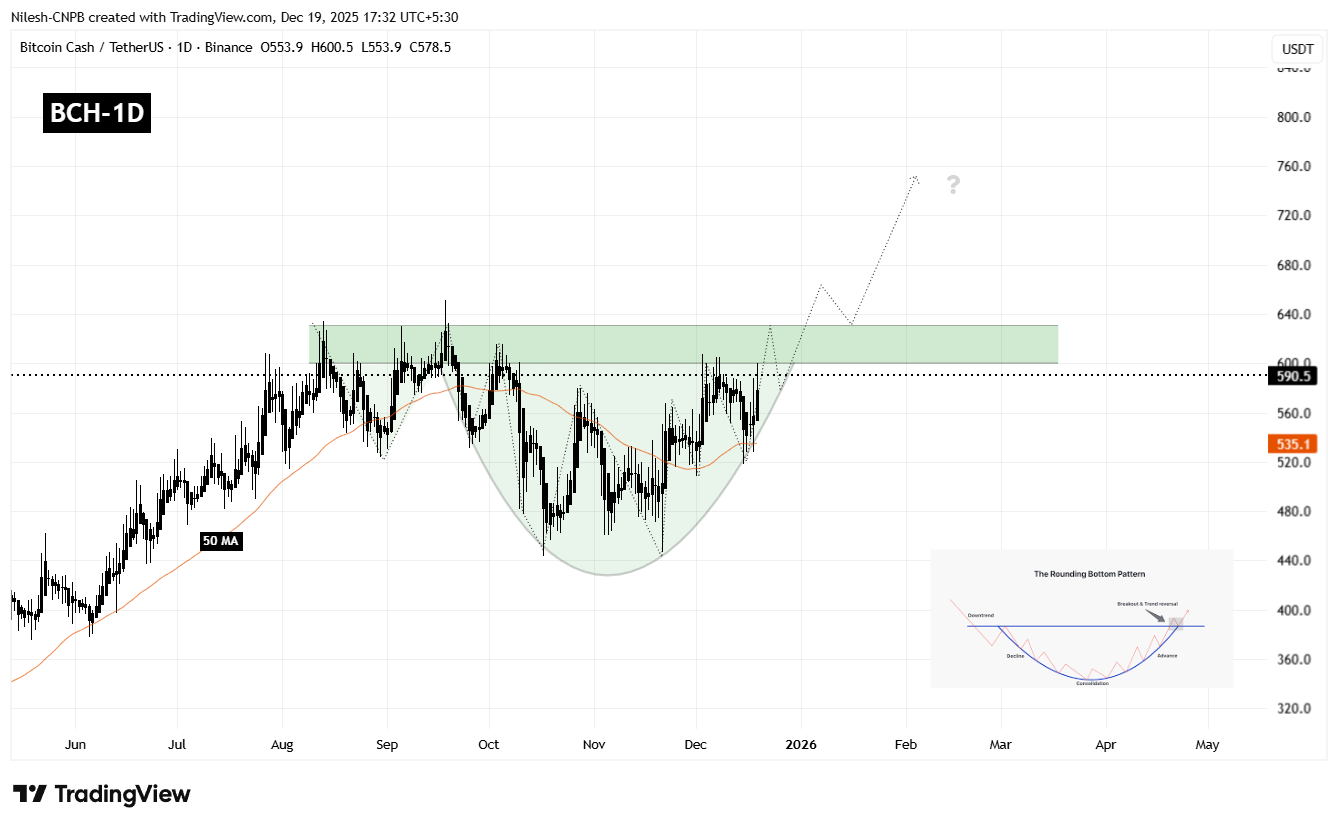
Bitcoin Cash (BCH) Daily Chart/Coinsprobe (Source: Tradingview)
Currently, BCH is trading around the $590 mark and pressing up against a well-defined resistance zone between $600 and $630. This area represents the neckline of the rounding bottom pattern and has capped price advances multiple times in the past, making it the most critical level to watch in the near term.
What’s Next for BCH?
A clean daily close above the $600–$630 resistance zone would confirm the bullish rounding bottom breakout. If that breakout is followed by a successful retest of the same zone as support, it would significantly strengthen the bullish case and suggest that a new upward leg is underway.
Based on the depth of the rounding structure, the projected upside target points toward the $800–$820 region. Reaching that zone would imply a potential upside of roughly 35–40% from current levels, aligning with the measured move typically associated with this pattern.
However, patience remains important. Before any confirmed breakout, BCH could still experience short-term pullbacks, including a dip toward the rising base of the rounding structure or the 50-day moving average, which has been acting as dynamic support during the recovery. Such pullbacks would not necessarily invalidate the bullish setup, as long as price continues to hold above the higher low structure.
Until a decisive breakout and retest occur, traders may want to remain cautious and avoid chasing price. The $600–$630 zone remains the line in the sand that will determine whether BCH transitions into a sustained bullish phase or remains range-bound for longer.
Disclaimer: The views and analysis presented in this article are for informational purposes only and reflect the author’s perspective, not financial advice. Technical patterns and indicators discussed are subject to market volatility and may or may not yield the anticipated results. Investors are advised to exercise caution, conduct independent research, and make decisions aligned with their individual risk tolerance.
Disclaimer: The information on this page may come from third parties and does not represent the views or opinions of Gate. The content displayed on this page is for reference only and does not constitute any financial, investment, or legal advice. Gate does not guarantee the accuracy or completeness of the information and shall not be liable for any losses arising from the use of this information. Virtual asset investments carry high risks and are subject to significant price volatility. You may lose all of your invested principal. Please fully understand the relevant risks and make prudent decisions based on your own financial situation and risk tolerance. For details, please refer to
Disclaimer.
Related Articles
Macro investors: A BTC breakout above $76,000 and an ETH breakout above $2,400 may signal a trend reversal
Macro investor Jordi Visser believes that if Bitcoin and Ethereum break through $76,000 and $2,400 respectively, it will kick off a sustainable uptrend. He expects high inflation to push investors to seek profitable assets, and notes that the probability of an economic recession has fallen to 24%. This view contrasts with the current bearish expectations in the crypto industry.
GateNews21m ago
Bitcoin Developers Release Major Update on Testnet, What Changed? - U.Today
Bitcoin developers have released v31.0rc4 for testing, introducing enhanced privacy through Tor and I2P networks, improved mempool design, fee efficiency, and performance upgrades. This update aims to optimize transaction management and protect user anonymity.
UToday1h ago
U.S.-Iran talks: after 21 hours, no agreement reached. Vance says he has proposed a “final proposal”; Iran refuses a nuclear weapons commitment.
The U.S. vice president, Vance, did not reach an agreement in the US-Iran negotiations held in Islamabad. The core dispute is that Iran refused the U.S. demand for a nuclear weapons commitment. The breakdown of the talks has increased geopolitical risk, affecting financial markets—especially crude oil and Bitcoin prices. Even though the negotiations were unsuccessful, both sides may still continue discussions, and the market will watch for further developments.
ChainNewsAbmedia1h ago
Famed trader “Maji” ends 13 straight wins, closing a Bitcoin long position at a loss of $192k
Gate News, April 12. Lookonchain monitoring shows that the well-known trader “Maji” saw their 13-win streak come to an end. Due to the market downturn, they just closed a Bitcoin long position, incurring a loss of about $192k.
GateNews3h ago
BTC 15-minute drop of 1.75%: Derivatives liquidity deterioration and capital withdrawals in sync weigh on prices
From 01:30 to 01:45 (UTC) on 2026-04-12, the BTC price saw significant volatility within the 71,560.0–73,017.1 USDT range. The candlestick return rate recorded -1.75%, and the amplitude reached 2.00%. During this period, market attention increased, the trading atmosphere clearly became more cautious, and heightened volatility triggered short-term capital vigilance.
The primary driving force behind this unusual move is the continued deterioration of liquidity in the derivatives market: CME futures open interest fell to a 14-month low, and institutional arbitrage capital accelerated its withdrawal. Futures trading volume trended lower over the long run, and arbitrage basis compression caused the market to deepen in…
GateNews4h ago
