

The TRON (TRX) price has reached a price zone that has stopped every rally for months. After a long stretch of lower highs, TRX is once again testing a downward trendline that sellers have defended repeatedly.
This test comes after a gradual climb from recent lows, bringing the market to a point where a decision is hard to avoid.
The price is no longer slipping lower. It is holding just beneath resistance and moving sideways with tighter swings. This kind of behavior often shows up before a clear move.
What matters now is whether buyers can push through this level, or if sellers step in and force another rejection.
- What the TRX Chart Is Showing
- TRON Price Momentum and Market Behavior
- TRX Short-Term Outlook
What the TRX Chart Is Showing
The chart shows a clear descending trendline stretching from prior highs, acting as a ceiling throughout the broader downtrend. Each rally into this zone has failed, keeping the structure bearish. This time, however, the approach looks different.
The TRX price is forming higher lows beneath the trendline, reducing downside momentum while gradually building pressure against resistance.
There has been support beneath the price as well, indicating that sellers do not fully have control. The longer the price is trapped in the rising support and falling resistance, the more likely it is to break out.
A clean break above the line, especially followed by acceptance above the line, would indicate the first structural change in several months. Failure here would likely send the TRON price back toward the lower range, keeping the broader trend intact.

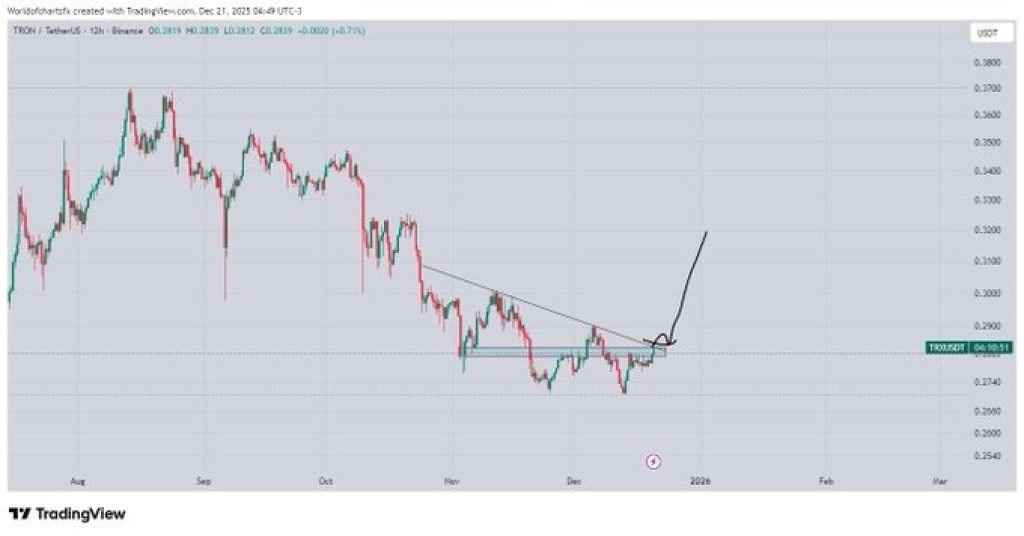
Source: X/WorldofCharts
TRON Price Momentum and Market Behavior
Momentum indicators reflect this balance. Selling pressure has cooled compared to earlier phases of the downtrend, while buying strength has not yet reached breakout conditions. This often signals indecision rather than exhaustion.
Volume has remained controlled, which fits with a market waiting for confirmation. A breakout attempt without volume would raise the risk of a fake move. In contrast, expanding volume on a trendline break would suggest real participation and improve the odds of continuation.
From a trend perspective, the TRX price remains technically bearish until proven otherwise. The descending structure is still valid, and buyers need to force a decisive shift to change that narrative.
_Read Also: _****Shiba Inu Shibarium Dispute: K9 Finance Finally Breaks Silence
TRX Short-Term Outlook
If the TRON price is able to move above the downward trend line and hold, the speed at which the momentum increases could accelerate as reluctant buyers make their moves.
Such a scenario would make possible a more general recovery pattern and would lead to the bias of the short-term indicator turning more to the upside.
If rejection occurs instead, the market likely revisits nearby support zones. Another failure at resistance would reinforce the existing downtrend and signal that sellers remain in control.
The TRX price is at a decision point. The next move away from this compression zone is likely to define direction in the near term, making this trendline test one of the most important technical moments for TRON in recent weeks.
Disclaimer: The information on this page may come from third parties and does not represent the views or opinions of Gate. The content displayed on this page is for reference only and does not constitute any financial, investment, or legal advice. Gate does not guarantee the accuracy or completeness of the information and shall not be liable for any losses arising from the use of this information. Virtual asset investments carry high risks and are subject to significant price volatility. You may lose all of your invested principal. Please fully understand the relevant risks and make prudent decisions based on your own financial situation and risk tolerance. For details, please refer to
Disclaimer.
Related Articles
Chainlink Sees 25% Whale Growth: Will LINK Push Toward $27?
Chainlink whales grew 25% in a year, signaling strong accumulation by large holders.
Institutional adoption and reserve growth tighten LINK supply, supporting potential upward price movement.
LINK trades in a narrow range; a breakout could push toward $27.
Chainlink — LINK, has been
CryptoNewsLand7m ago
Hyperliquid Faces Volatility as Whales Shift Positions: Will HYPE Hold $35?
Whale activity drives HYPE volatility, creating uncertainty around short-term price movements.
Accumulation trends remain strong, with investors moving $11.7 million HYPE off exchanges.
Key support at $33.48–$35.19 may determine whether HYPE rebounds or drops further.
Hyperliquid — HYPE,
CryptoNewsLand1h ago
BTC profit/loss trade ratio is 2.95, the highest level in 12 weeks
Gate News message: On April 6, according to Santiment data, the BTC profit-loss trade ratio reached 2.95, the highest level in 12 weeks. This indicator measures the ratio of profitable trades to losing trades; the current value shows that the share of profitable trades in the market is significantly higher than that of losing trades, reaching a recent peak level.
GateNews1h ago
SHIB Climbs 1.45% as Golden Cross Signals Potential Breakout
Price rises 1.45% as golden cross signals possible bullish momentum.
Spot inflows surge, indicating some holders may lock in profits.
Open interest rises cautiously, showing traders hesitant to commit strongly.
Shiba Inu has attracted attention after climbing 1.45% over the past 24
CryptoNewsLand2h ago
The RWA Yield Infrastructure Trade
The essay highlights challenges in direct RWA token exposure, emphasizes the potential in leverage opportunities amid settlement delays, critiques Morpho's governance token structure, and presents Fluid as a more effective token model with stablecoin links.
CoinDesk2h ago
BTC 15-minute pullback of 0.66%: Trade policy shock combined with large holders selling off triggers downside pressure
From 06:15 to 06:30 (UTC) on 2026-04-06, the BTC price dropped from 68807.2 to 69308.1 USDT; the 15-minute return recorded -0.66%, and the amplitude reached 0.72%. During this period, market volatility intensified, with trading volume and social discussion heat increasing in tandem, reflecting intense short-term capital games.
The main driving force behind this abnormal movement came from sudden changes at the macro policy level. The United States has recently increased tariffs and continued its high-tariff policy, causing a sharp drop in global risk appetite and prompting investors to withdraw en masse from high-volatility assets. Related con
GateNews2h ago
