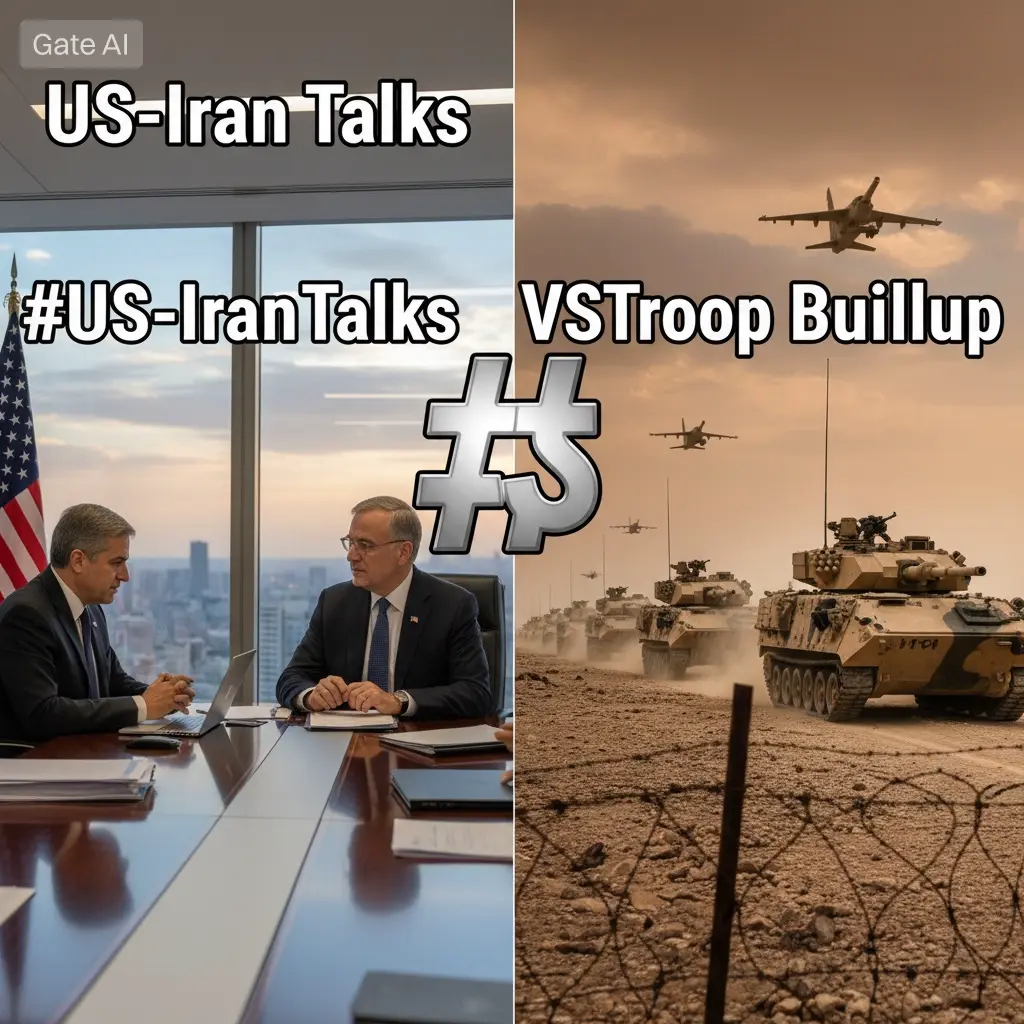
#US-IranTalksVSTroopBuildup
1 — Background: What Exactly Is Happening?
In late February 2026, the United States launched military operations against Iran — codenamed Operation Epic Fury — marking the beginning of a direct armed conflict that shook global markets to their core. Since that moment, two parallel tracks have been running simultaneously, and understanding both is essential before we discuss crypto.
Track A: The Diplomatic Track (Talking)
In early April 2026, the US and Iran agreed to a fragile two-week ceasefire after President Trump set a hard deadline.
On April 11, 2026, US Vice President JD Vance flew to Islamabad, Pakistan for direct three-party talks (US, Iran, Pakistan as mediator).
The talks ran for a marathon session but failed to produce an agreement.
The core sticking point: the US demanded Iran commit to never seeking nuclear weapons and abandon enrichment capabilities. Iran refused, calling the US terms unacceptable.
Iran's wish list was much broader — it wanted sanctions relief, recognition of sovereignty over the Strait of Hormuz, and a region-wide ceasefire covering Lebanon, Yemen, and beyond.
A second round of talks was being considered as of April 14, with "significant progress" reported by some US officials as recently as this week (April 15-17).
Track B: The Military Track (Building Up)
While diplomacy was ongoing, the Pentagon was simultaneously deploying thousands of additional troops to the region.
The US deployed 82nd Airborne Division soldiers, the USS Tripoli carrying 3,500 Marines, and the USS George H.W. Bush naval carrier group.
As of April 15, the US is reportedly preparing 10,000+ additional troops for the Middle East — the largest such buildup since the Iraq War era.
Another 4,200 troops via the Boxer Amphibious Ready Group are expected by end of April 2026.
The US is also enforcing a maritime blockade against Iran while negotiating — applying maximum economic and military pressure simultaneously.
Part 2 — The "Fog of War" Doctrine Explained
This dual-track strategy is a classic coercive diplomacy playbook, sometimes called the "Fog of War" strategy:
Step 1 — Apply Maximum Pressure
Deploy troops, warships, and economic sanctions to make the cost of non-compliance extremely high. Iran must feel that not agreeing is more dangerous than agreeing.
Step 2 — Keep the Door Open
Maintain a diplomatic channel so the opponent has a face-saving exit. Without a negotiated off-ramp, the adversary has no incentive to back down.
Step 3 — Create Uncertainty
Neither side knows whether the other will blink first. Iran does not know if the US will strike again. The US does not know if Iran will resume nuclear enrichment. This uncertainty keeps both sides at the table.
Step 4 — Time as Leverage
Every day the blockade continues, Iranian oil exports shrink and the economy deteriorates. Every day US troops remain deployed, the cost to American taxpayers rises. Both sides are racing against their own domestic pressures.
Part 3 — Where the Market Stands Right Now
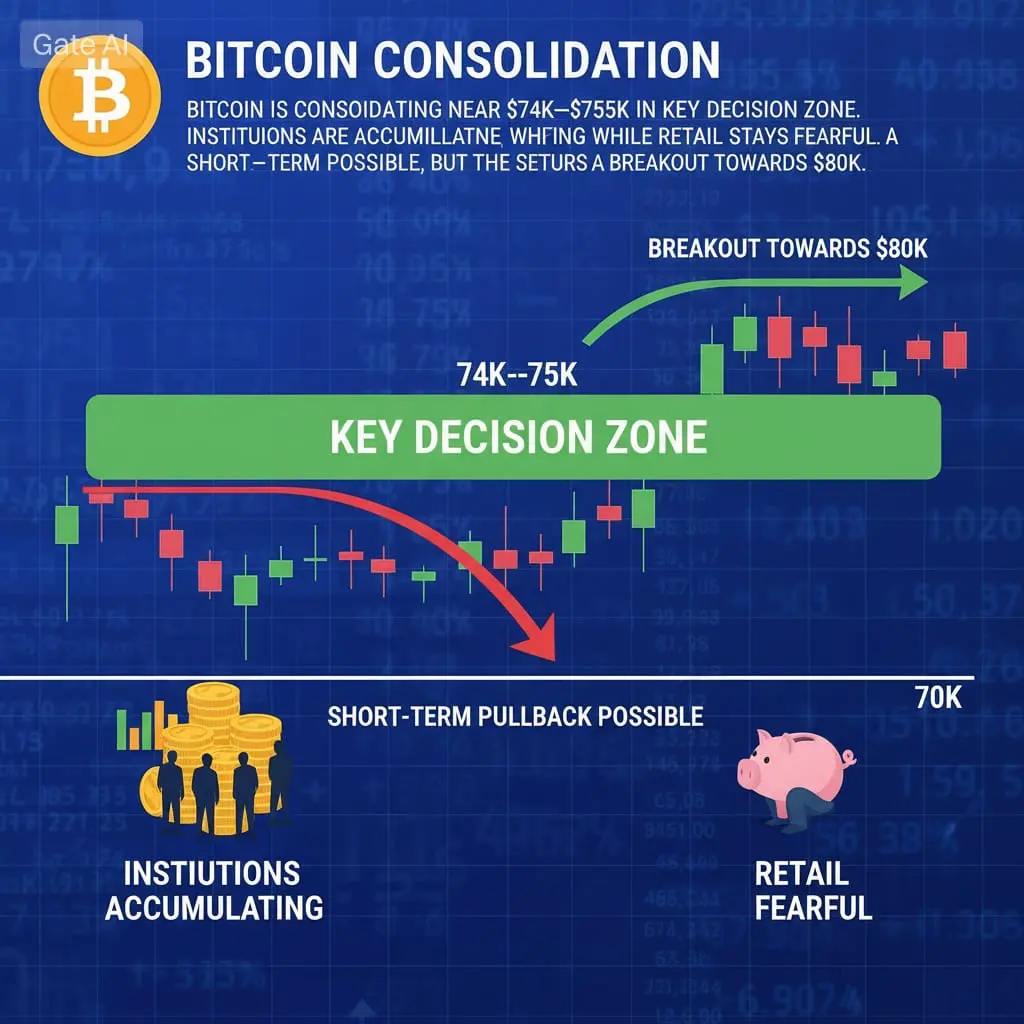
Before discussing where the crypto market could go, here is the current snapshot (as of April 17, 2026):
Asset Current Price 24h Change 30d Change
BTC $75,005 +0.26% +7.27%
ETH $2,347 -0.55% +9.79%
Key market context from news data:
Since the Iran conflict began in late February, BTC has been rangebound between $60,000 and $75,000 — unable to break out decisively in either direction.
When the ceasefire was announced on April 7, BTC jumped sharply and squeezed $427 million in short positions.
When the Islamabad talks collapsed on April 11, BTC dropped from $73,000 back to $70,000 within hours.
BTC is currently at $75,005 — near the top of its war range — as traders price in a possible second round of talks producing results.
Part 4 — How This Situation Directly Impacts Crypto: Step by Step
Step 1 — Risk Appetite Is the Master Switch
Crypto is treated as a risk-on asset by institutional investors. When geopolitical fear rises (war escalation, failed talks, troop surges), institutional money flows out of BTC, ETH, and risk assets into gold, US Treasuries, and the dollar. When fear subsides (ceasefire hopes, framework deal), money rotates back into risk assets — and crypto benefits first because it is the most liquid 24/7 market.
Practical implication: Every headline about the Iran conflict moves crypto more directly and faster than equity markets, because crypto never closes.
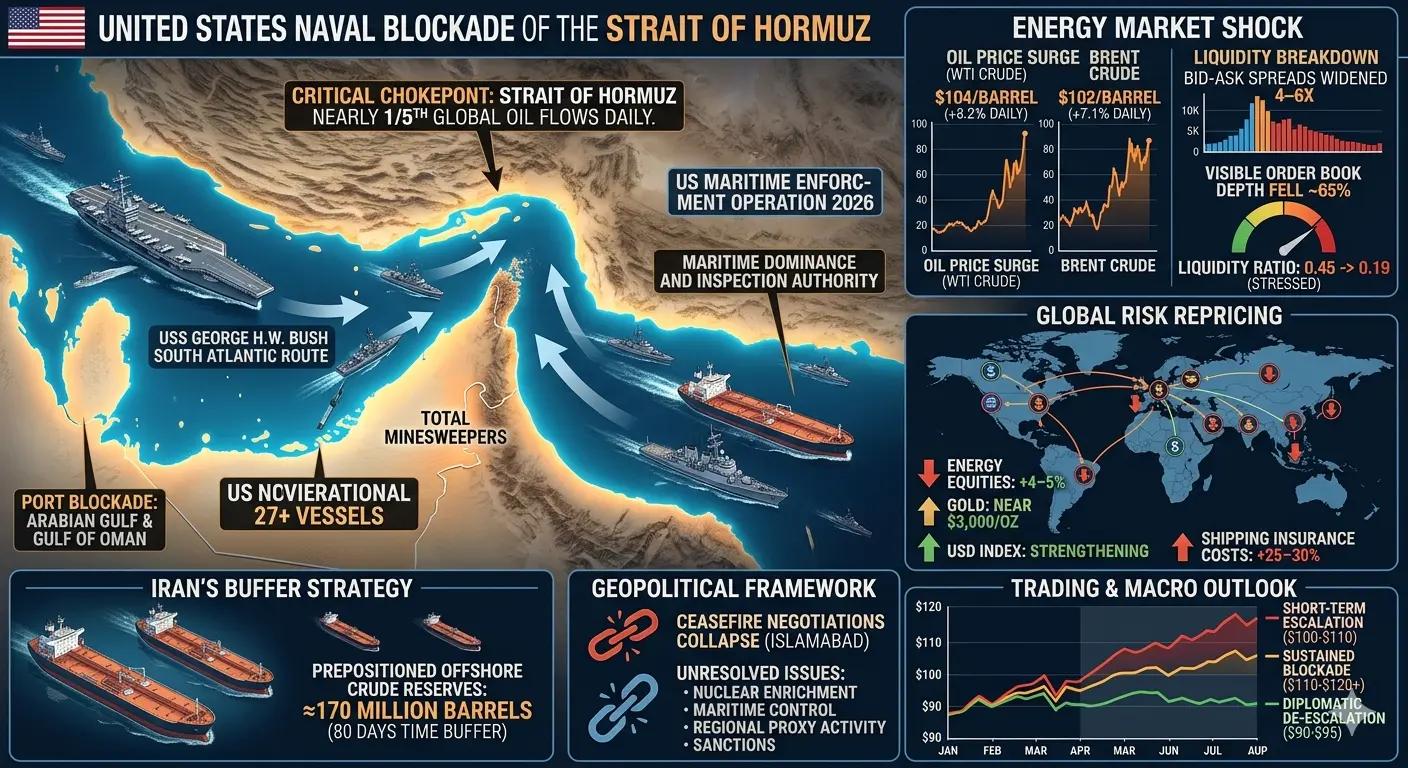
Step 2 — Oil Price Is the Transmission Mechanism
The Strait of Hormuz handles approximately 20% of global oil trade. The US blockade of Iranian oil + the threat of Hormuz disruptions has kept oil prices elevated above $100/barrel since March 2026.
High oil means:
Higher inflation globally
Central banks (especially the Fed) are reluctant to cut interest rates
The Fed has effectively priced out all rate cuts for 2026 because of Iran-war inflation
High rates = less liquidity = less speculative capital available for crypto
Practical implication: Even if you are bullish on BTC, the oil-rate linkage is acting as a ceiling on how far any crypto rally can go right now.
Step 3 — Federal Reserve Is Frozen
This is one of the most under-discussed impacts. Before the Iran conflict, markets were pricing in multiple Fed rate cuts in 2026. After the conflict began, those expectations were entirely wiped out — the Fed's PCE inflation forecast has been revised to 2.7% for 2026, and Chair Powell explicitly said the Fed will wait to see how the Iran war affects inflation before making any moves.
Practical implication: The single most powerful liquidity catalyst for a crypto bull run — rate cuts — is being held hostage by the Iran situation. A peace deal would almost immediately revive rate-cut expectations, which would be enormously bullish for BTC.
Step 4 — Sentiment Volatility Creates Trading Opportunities But Not Trend
The pattern so far has been clear:
Ceasefire news = BTC +3% to +5% spike, short squeeze
Talks failure = BTC -2% to -4% drop, fear returns
Troop buildup news = modest downward pressure, but not panic
This means the market is not trending; it is oscillating inside a war range ($60,000-$75,000), reacting to diplomatic headlines. This is a news-driven, not fundamentals-driven market environment.
Step 5 — Regulatory Tailwind Is a Secondary Catalyst
Analysts have noted that the US Clarity Act, a major piece of crypto regulation, is expected to pass in late April 2026. This could unlock a wave of institutional capital regardless of the Iran outcome. If a peace deal coincides with the Clarity Act passage, the combined effect would be unusually powerful.
Part 5 — Scenario Analysis: Where Can the Market Go?
Scenario A: A Formal Peace Deal / Extended Ceasefire is Reached
If the second round of talks (which appears to be in progress as of this week) produces a framework agreement:
Oil drops below $100/barrel — inflation pressure eases
Fed rate cut expectations come back — markets price in 1-2 cuts for late 2026
Risk-on sentiment returns — institutional money re-enters equities and crypto
BTC's immediate resistance at $75,000-$76,000 breaks convincingly
Analyst targets of $80,000+ become realistic within weeks of the deal
ETH, which has been suppressed at -$2,300, could rally toward $2,800-$3,000
Altcoins typically rally harder than BTC in a genuine risk-on environment (10%-30% moves are common in this scenario)
Bull case price milestone: BTC targeting $85,000-$90,000 over 60-90 days if a lasting deal is confirmed and the Fed signals even one rate cut.
Scenario B: Talks Continue Without Resolution (Current State)
BTC stays trapped in the $68,000-$76,000 range
Every positive headline = brief pump, every negative headline = brief dump
Traders can play the swings, but no sustained trend either way
Oil stays elevated, Fed stays on hold
The Clarity Act passage alone might give a $3,000-$5,000 upside nudge to BTC
This is the base case as of April 17, 2026
Scenario C: Talks Collapse and Conflict Escalates
If the ceasefire breaks down completely and US strikes resume, or if Iran moves to close the Strait of Hormuz:
Oil spikes to $115-$130/barrel
Global recession fears intensify
BTC tests the lower end of its war range — $60,000 support becomes critical
A break below $60,000 could trigger a drop toward $52,000-$55,000
This scenario is the bear case, but currently not the market's primary expectation
Part 6 — Key Levels to Watch Right Now
BTC:
Immediate resistance: $75,500 - $76,000 (ceasefire high)
Strong support: $68,000 - $70,000 (post-failed-talks floor)
War range floor: $60,000 (do not want to see a close below this)
Bull breakout target: $80,000+ (requires confirmed deal)
Macro indicators to monitor alongside crypto:
WTI Crude Oil: watch for a sustained drop below $95/barrel (peace signal)
Fed Funds Futures: any repricing of rate cuts = bullish for BTC
US 10-Year Treasury Yield: falling yield = risk-on = crypto positive
Part 7 — The Bottom Line
The #US-IranTalksVSTroopBuildup situation is, in one sentence, a pressure cooker with a diplomatic release valve — and the crypto market is sitting directly on the lid.
The mechanics are straightforward:
1. Peace deal confirmed → oil falls → Fed loosens → liquidity returns → BTC breaks $80,000
2. Stalemate continues → BTC oscillates in war range → trade the swings, not the trend
3. Conflict escalates → BTC tests $60,000 → risk management becomes the priority
Right now, BTC at $75,005 is pricing in cautious optimism that talks will resume and eventually produce something. The market is not pricing in a full peace deal yet, which means the upside from a confirmed agreement is still significant and largely unrealized.
The most important variable is not the number of troops deployed — it is whether the second round of talks produces a workable framework on nuclear enrichment. That single data point will determine which scenario plays out.
1 — Background: What Exactly Is Happening?
In late February 2026, the United States launched military operations against Iran — codenamed Operation Epic Fury — marking the beginning of a direct armed conflict that shook global markets to their core. Since that moment, two parallel tracks have been running simultaneously, and understanding both is essential before we discuss crypto.
Track A: The Diplomatic Track (Talking)
In early April 2026, the US and Iran agreed to a fragile two-week ceasefire after President Trump set a hard deadline.
On April 11, 2026, US Vice President JD Vance flew to Islamabad, Pakistan for direct three-party talks (US, Iran, Pakistan as mediator).
The talks ran for a marathon session but failed to produce an agreement.
The core sticking point: the US demanded Iran commit to never seeking nuclear weapons and abandon enrichment capabilities. Iran refused, calling the US terms unacceptable.
Iran's wish list was much broader — it wanted sanctions relief, recognition of sovereignty over the Strait of Hormuz, and a region-wide ceasefire covering Lebanon, Yemen, and beyond.
A second round of talks was being considered as of April 14, with "significant progress" reported by some US officials as recently as this week (April 15-17).
Track B: The Military Track (Building Up)
While diplomacy was ongoing, the Pentagon was simultaneously deploying thousands of additional troops to the region.
The US deployed 82nd Airborne Division soldiers, the USS Tripoli carrying 3,500 Marines, and the USS George H.W. Bush naval carrier group.
As of April 15, the US is reportedly preparing 10,000+ additional troops for the Middle East — the largest such buildup since the Iraq War era.
Another 4,200 troops via the Boxer Amphibious Ready Group are expected by end of April 2026.
The US is also enforcing a maritime blockade against Iran while negotiating — applying maximum economic and military pressure simultaneously.
Part 2 — The "Fog of War" Doctrine Explained
This dual-track strategy is a classic coercive diplomacy playbook, sometimes called the "Fog of War" strategy:
Step 1 — Apply Maximum Pressure
Deploy troops, warships, and economic sanctions to make the cost of non-compliance extremely high. Iran must feel that not agreeing is more dangerous than agreeing.
Step 2 — Keep the Door Open
Maintain a diplomatic channel so the opponent has a face-saving exit. Without a negotiated off-ramp, the adversary has no incentive to back down.
Step 3 — Create Uncertainty
Neither side knows whether the other will blink first. Iran does not know if the US will strike again. The US does not know if Iran will resume nuclear enrichment. This uncertainty keeps both sides at the table.
Step 4 — Time as Leverage
Every day the blockade continues, Iranian oil exports shrink and the economy deteriorates. Every day US troops remain deployed, the cost to American taxpayers rises. Both sides are racing against their own domestic pressures.
Part 3 — Where the Market Stands Right Now
Before discussing where the crypto market could go, here is the current snapshot (as of April 17, 2026):
Asset Current Price 24h Change 30d Change
BTC $75,005 +0.26% +7.27%
ETH $2,347 -0.55% +9.79%
Key market context from news data:
Since the Iran conflict began in late February, BTC has been rangebound between $60,000 and $75,000 — unable to break out decisively in either direction.
When the ceasefire was announced on April 7, BTC jumped sharply and squeezed $427 million in short positions.
When the Islamabad talks collapsed on April 11, BTC dropped from $73,000 back to $70,000 within hours.
BTC is currently at $75,005 — near the top of its war range — as traders price in a possible second round of talks producing results.
Part 4 — How This Situation Directly Impacts Crypto: Step by Step
Step 1 — Risk Appetite Is the Master Switch
Crypto is treated as a risk-on asset by institutional investors. When geopolitical fear rises (war escalation, failed talks, troop surges), institutional money flows out of BTC, ETH, and risk assets into gold, US Treasuries, and the dollar. When fear subsides (ceasefire hopes, framework deal), money rotates back into risk assets — and crypto benefits first because it is the most liquid 24/7 market.
Practical implication: Every headline about the Iran conflict moves crypto more directly and faster than equity markets, because crypto never closes.
Step 2 — Oil Price Is the Transmission Mechanism
The Strait of Hormuz handles approximately 20% of global oil trade. The US blockade of Iranian oil + the threat of Hormuz disruptions has kept oil prices elevated above $100/barrel since March 2026.
High oil means:
Higher inflation globally
Central banks (especially the Fed) are reluctant to cut interest rates
The Fed has effectively priced out all rate cuts for 2026 because of Iran-war inflation
High rates = less liquidity = less speculative capital available for crypto
Practical implication: Even if you are bullish on BTC, the oil-rate linkage is acting as a ceiling on how far any crypto rally can go right now.
Step 3 — Federal Reserve Is Frozen
This is one of the most under-discussed impacts. Before the Iran conflict, markets were pricing in multiple Fed rate cuts in 2026. After the conflict began, those expectations were entirely wiped out — the Fed's PCE inflation forecast has been revised to 2.7% for 2026, and Chair Powell explicitly said the Fed will wait to see how the Iran war affects inflation before making any moves.
Practical implication: The single most powerful liquidity catalyst for a crypto bull run — rate cuts — is being held hostage by the Iran situation. A peace deal would almost immediately revive rate-cut expectations, which would be enormously bullish for BTC.
Step 4 — Sentiment Volatility Creates Trading Opportunities But Not Trend
The pattern so far has been clear:
Ceasefire news = BTC +3% to +5% spike, short squeeze
Talks failure = BTC -2% to -4% drop, fear returns
Troop buildup news = modest downward pressure, but not panic
This means the market is not trending; it is oscillating inside a war range ($60,000-$75,000), reacting to diplomatic headlines. This is a news-driven, not fundamentals-driven market environment.
Step 5 — Regulatory Tailwind Is a Secondary Catalyst
Analysts have noted that the US Clarity Act, a major piece of crypto regulation, is expected to pass in late April 2026. This could unlock a wave of institutional capital regardless of the Iran outcome. If a peace deal coincides with the Clarity Act passage, the combined effect would be unusually powerful.
Part 5 — Scenario Analysis: Where Can the Market Go?
Scenario A: A Formal Peace Deal / Extended Ceasefire is Reached
If the second round of talks (which appears to be in progress as of this week) produces a framework agreement:
Oil drops below $100/barrel — inflation pressure eases
Fed rate cut expectations come back — markets price in 1-2 cuts for late 2026
Risk-on sentiment returns — institutional money re-enters equities and crypto
BTC's immediate resistance at $75,000-$76,000 breaks convincingly
Analyst targets of $80,000+ become realistic within weeks of the deal
ETH, which has been suppressed at -$2,300, could rally toward $2,800-$3,000
Altcoins typically rally harder than BTC in a genuine risk-on environment (10%-30% moves are common in this scenario)
Bull case price milestone: BTC targeting $85,000-$90,000 over 60-90 days if a lasting deal is confirmed and the Fed signals even one rate cut.
Scenario B: Talks Continue Without Resolution (Current State)
BTC stays trapped in the $68,000-$76,000 range
Every positive headline = brief pump, every negative headline = brief dump
Traders can play the swings, but no sustained trend either way
Oil stays elevated, Fed stays on hold
The Clarity Act passage alone might give a $3,000-$5,000 upside nudge to BTC
This is the base case as of April 17, 2026
Scenario C: Talks Collapse and Conflict Escalates
If the ceasefire breaks down completely and US strikes resume, or if Iran moves to close the Strait of Hormuz:
Oil spikes to $115-$130/barrel
Global recession fears intensify
BTC tests the lower end of its war range — $60,000 support becomes critical
A break below $60,000 could trigger a drop toward $52,000-$55,000
This scenario is the bear case, but currently not the market's primary expectation
Part 6 — Key Levels to Watch Right Now
BTC:
Immediate resistance: $75,500 - $76,000 (ceasefire high)
Strong support: $68,000 - $70,000 (post-failed-talks floor)
War range floor: $60,000 (do not want to see a close below this)
Bull breakout target: $80,000+ (requires confirmed deal)
Macro indicators to monitor alongside crypto:
WTI Crude Oil: watch for a sustained drop below $95/barrel (peace signal)
Fed Funds Futures: any repricing of rate cuts = bullish for BTC
US 10-Year Treasury Yield: falling yield = risk-on = crypto positive
Part 7 — The Bottom Line
The #US-IranTalksVSTroopBuildup situation is, in one sentence, a pressure cooker with a diplomatic release valve — and the crypto market is sitting directly on the lid.
The mechanics are straightforward:
1. Peace deal confirmed → oil falls → Fed loosens → liquidity returns → BTC breaks $80,000
2. Stalemate continues → BTC oscillates in war range → trade the swings, not the trend
3. Conflict escalates → BTC tests $60,000 → risk management becomes the priority
Right now, BTC at $75,005 is pricing in cautious optimism that talks will resume and eventually produce something. The market is not pricing in a full peace deal yet, which means the upside from a confirmed agreement is still significant and largely unrealized.
The most important variable is not the number of troops deployed — it is whether the second round of talks produces a workable framework on nuclear enrichment. That single data point will determine which scenario plays out.