 The post Ethereum Whales Underwater—Is This the ETH Price Capitulation or a Calm Before a Strong Rebound? appeared first on Coinpedia Fintech News
After breaking above the local consolidation range near $1,950, the Ethereum price has pushed higher toward the psychological $2,000 level. ETH is trading around $1,988, up roughly 1.1% in the past 24 hours, slightly outperforming Bitcoin’s sub-1% move. The uptick appears to reflect a mild risk-on rotation into altcoins rather than any clear fundamental catalyst.
However, beneath the surface, on-chain data paints a more cautious picture. Despite the bounce, major ETH whale cohorts remain underwater on unrealized profits. If even large holders are still under pressure, the key question becomes whether this rally has real strength, or if Ethereum has yet to print its true cycle bottom.
All Ethereum Whale Cohorts Turn Underwater: A Cycle Reset Moment?
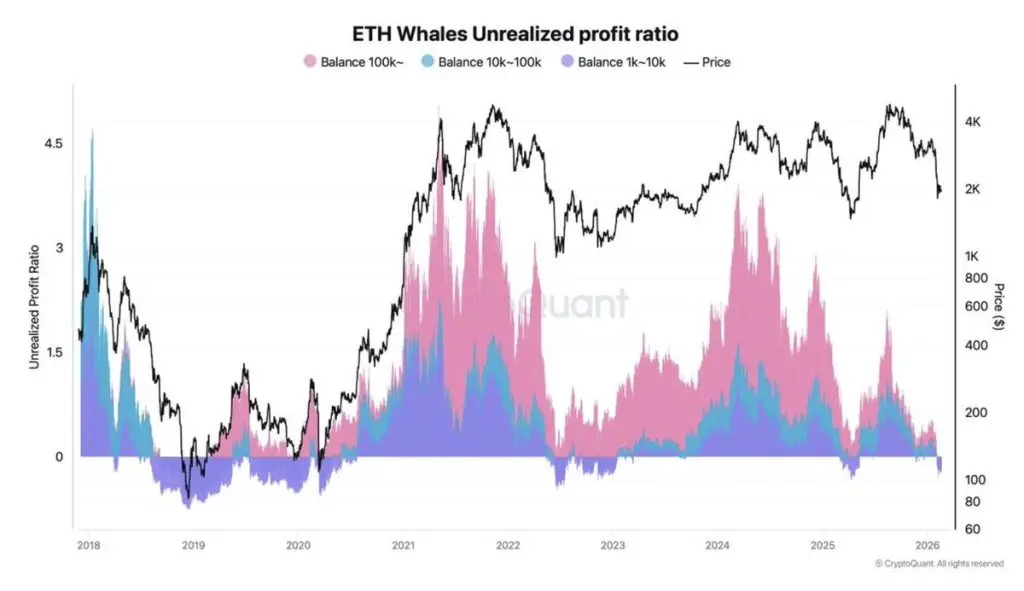
![]() The chart tracking Ethereum whales’ unrealized profit ratio reveals a critical shift in market structure. For the first time this cycle, every major ETH holder group, from 1K–10K wallets to 100K+ ETH addresses, has entered unrealized losses. Historically, large cohorts tend to stay profitable during corrections, providing long-term support to the Ethereum price. But the current drawdown has pushed even the strongest hands below breakeven.
The chart tracking Ethereum whales’ unrealized profit ratio reveals a critical shift in market structure. For the first time this cycle, every major ETH holder group, from 1K–10K wallets to 100K+ ETH addresses, has entered unrealized losses. Historically, large cohorts tend to stay profitable during corrections, providing long-term support to the Ethereum price. But the current drawdown has pushed even the strongest hands below breakeven.
 Source: X
This development signals broad market stress rather than a simple retail shakeout. When whale wallets turn underwater, it often reflects deep capitulation conditions and late-stage cycle pressure. In previous cycles, similar resets have preceded major trend reversals, but only after volatility peaks and selling exhausts.
Source: X
This development signals broad market stress rather than a simple retail shakeout. When whale wallets turn underwater, it often reflects deep capitulation conditions and late-stage cycle pressure. In previous cycles, similar resets have preceded major trend reversals, but only after volatility peaks and selling exhausts.
If Ethereum stabilises near current levels and whales resume accumulating, this zone could evolve into a long-term bottom. However, sustained weakness may prolong consolidation before a meaningful recovery unfolds.
Ethereum Price Analysis: Key Levels to Watch as Volatility Compresses
On the daily chart, Ethereum remains under pressure after breaking decisively below the $2,750–$2,800 demand zone, confirming a major structure breakdown. Price is now consolidating around $1,990, just below the 20-day SMA near $2,038, while the upper Bollinger Band sits around $2,260 — highlighting strong overhead resistance.
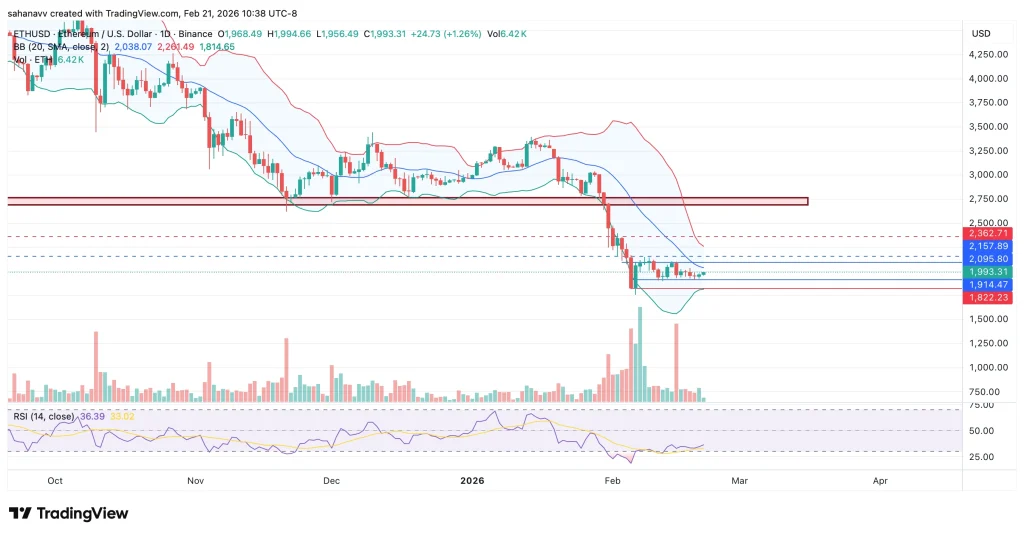 The lower Bollinger Band near $1,814 marked the recent capitulation wick low around $1,820–$1,850, which now acts as critical short-term support. A daily close below $1,914 could reopen downside toward $1,820, and a breakdown there exposes $1,700 next.
RSI is hovering near 36, recovering from oversold territory but still below the 50 midline — signaling weak bullish momentum. For bulls to regain control, ETH must reclaim $2,095 first, followed by a stronger breakout above $2,157. A sustained move above $2,260 would invalidate the immediate bearish bias and shift targets toward $2,360.
Until $2,157–$2,260 is reclaimed decisively, rallies are likely corrective rather than trend-reversing.
Disclaimer: The information on this page may come from third parties and does not represent the views or opinions of Gate. The content displayed on this page is for reference only and does not constitute any financial, investment, or legal advice. Gate does not guarantee the accuracy or completeness of the information and shall not be liable for any losses arising from the use of this information. Virtual asset investments carry high risks and are subject to significant price volatility. You may lose all of your invested principal. Please fully understand the relevant risks and make prudent decisions based on your own financial situation and risk tolerance. For details, please refer to
Disclaimer.
Related Articles
Bitcoin Halving Two-Years Anniversary: Annual inflation rate drops to 0.85%, officially becoming a rarer asset than gold
The Bitcoin halving in April 2024 lowered its annual inflation rate to 0.85%, for the first time below gold’s 1.5–2%. Bitcoin’s scarcity comes from code rules: supply will gradually decrease, and another halving is expected again in 2028. This halving cycle witnessed increased participation from institutional investors, strengthening Bitcoin’s position as digital gold.
ChainNewsAbmedia2m ago
Bhutan Reduces Bitcoin Stash From 13000 BTC to Under 4000 in 18 Months
_Bhutan cuts Bitcoin holdings from 13,000 BTC to 3,954 BTC in 18 months, with $215.7M transferred out and mining inflows declining_
Bhutan has reduced its Bitcoin holdings over the past 18 months, based on new blockchain data.
Arkham data shows a steady decline in the country’s reserves since
LiveBTCNews19m ago
'Not Going to Stop at Bitcoin': Morgan Stanley Weighs Tokenization, Tax Solutions in Crypto Push
In brief
Amy Oldenburg, head of digital-asset strategy at Morgan Stanley, sees a tokenized money-market fund as a natural path forward for its crypto roadmap.
What’s more, the investment bank with $9.3 trillion in client
Decrypt39m ago
Crypto analyst Murphy: The current difficulty of trading BTC in the short term is extremely high—sharing my personal trade records and risk management strategies
Bitcoin’s short-term trading difficulty is increasing. Analyst Murphy recommends adopting a DCA (dollar-cost averaging) strategy over the next six months, with a win rate approaching 100%. He emphasizes the need to distinguish between investing and trading, avoid wishful thinking, follow the long-term trend, and strictly adhere to short-term trading discipline.
GateNews1h ago
Bitcoin Hits $73K as US CPI Data Cools, Gas Prices Hit 60-Year High
Bitcoin traded near the $73,000 zone after the March CPI print came in cooler than some forecasts, easing some inflation fears and setting the stage for a cautious push higher. The Bureau of Labor Statistics showed the consumer price index rose modestly, with energy costs driving the month’s big
CryptoBreaking1h ago
