Record-low RSI and a 50% OI drop signal deep stress as ETF outflows weaken institutional support.
Bitcoin has printed one of the most extreme technical readings in its history. Momentum has collapsed to levels never recorded on the weekly timeframe. As spotted by Ash Crypto, weekly RSI has fallen below every prior macro panic event. Notably, the current conditions place Bitcoin in rare statistical territory.
Historic RSI Breakdown Meets 50% Open Interest Collapse in Bitcoin Market
Trading near $64,000, Bitcoin’s weekly RSI has dropped into the mid-20s. That reading sits below levels seen during the Mt. Gox collapse, 2018 bear market bottom, March 2020 COVID crash, and 2022 FTX selloff.
BITCOIN JUST MADE HISTORY.
But it’s not something we all wanted.
Bitcoin weekly RSI has just reached its lowest level in history.
– Lower than tariffs Crash
– Lower than the FTX crash
– Lower than the Covid Crash
– Lower than the 2018 bottom
– Lower than the Mt. Gox hack… pic.twitter.com/HRWQZD0GRY
— Ash Crypto (@AshCrypto) February 24, 2026
Historically, major cycle lows have formed when the weekly RSI reached the 30–35 range. Even during capitulation phases, readings rarely stayed under 30 for long. Current compression marks an outlier in Bitcoin’s price history.
Derivatives data shows clear stress across the market. Open interest across exchanges has dropped from around $45–47 billion at the 2025 highs to about $21 billion. That is a decline of more than 50%. As a result, many traders have closed or been forced out of their positions, even though the price is still well above past-cycle lows.
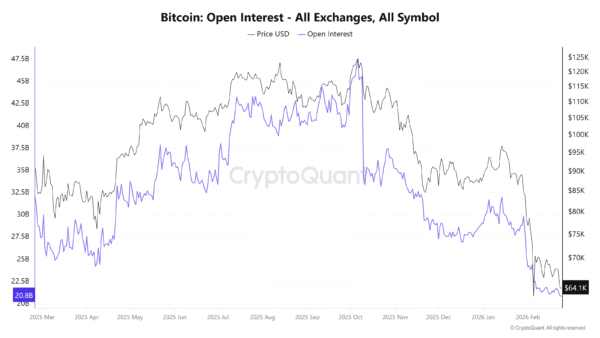
_Image Source: _CryptoQuant
At the same time, liquidations have removed excess risk faster than the spot price has fallen. In previous cycles, sharp drops in open interest were often followed by large price moves. However, direction usually depended on whether strong spot buying returned.
BTC Faces Multi-Timeframe Pressure as Valuation Nears Long-Term Support
On-chain data shows more pressure building, but not full capitulation. As per data, the MVRV ratio has dropped to around 1.1, which is close to long-term value support. In past cycles, market tops formed above 2.5. Meanwhile, normal mid-cycle conditions ranged between 1.5 and 2.0. Capitulation usually appeared near 1.0.
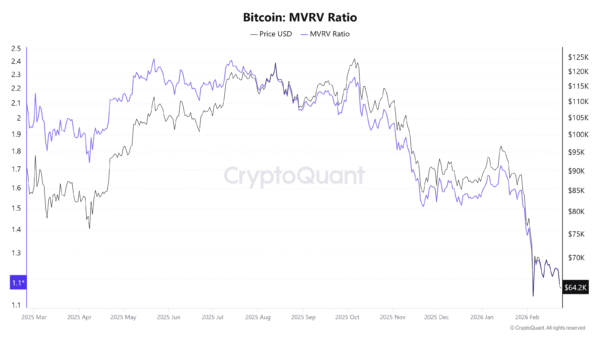
_Image Source: _CryptoQuant
At current levels, Bitcoin is trading close to the average cost basis of holders. However, it has not fallen below 1.0, where deeper loss conditions and stronger long-term bottoms often form.
At the same time, institutional flows look weaker than in past resets. Spot Bitcoin ETFs have seen about $1.2 billion in monthly net outflows. As the price declined, total net assets also moved lower.
During the 2024–2025 rally, steady ETF inflows helped push prices higher. Now, price is falling while flows remain negative. As a result, institutional demand appears to be slowing rather than returning.
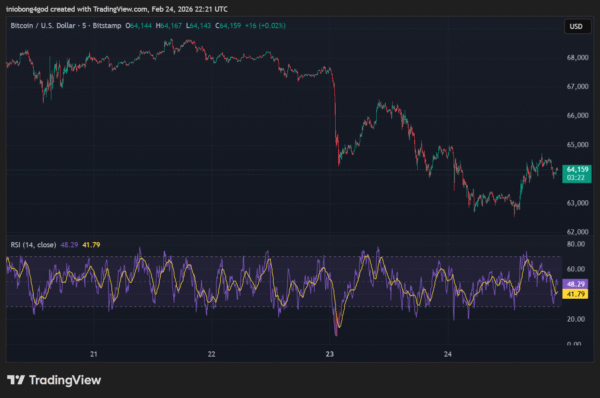
_Image Source: _TradingView
Short-term momentum is starting to stabilize. The five-hour RSI recently dropped into oversold levels, then bounced back toward neutral. As a result, immediate selling pressure seems to have eased around the $64,000 area.
However, higher timeframes remain deeply oversold. So while short-term pressure has cooled, longer-term momentum is still very weak, creating tension across multiple timeframes.
Disclaimer: The information on this page may come from third parties and does not represent the views or opinions of Gate. The content displayed on this page is for reference only and does not constitute any financial, investment, or legal advice. Gate does not guarantee the accuracy or completeness of the information and shall not be liable for any losses arising from the use of this information. Virtual asset investments carry high risks and are subject to significant price volatility. You may lose all of your invested principal. Please fully understand the relevant risks and make prudent decisions based on your own financial situation and risk tolerance. For details, please refer to
Disclaimer.
Related Articles
Morgan Stanley Purchases 177.76 BTC Worth $13.75 Million
Gate News message, Morgan Stanley bought 177.76 BTC worth $13.75M three hours ago. The firm now holds 1,347.54 BTC worth $103.94M in total.
GateNews1h ago
BTC fell below 77000 USDT
Gate News bot message, Gate quotes show that BTC fell below 77000 USDT, trading at 76961.6 USDT.
CryptoRadar2h ago
NYSE Welcomes Morgan Stanley’s MSBT Launch as First Spot Bitcoin ETF Issued by a Major US Bank
Bank-backed bitcoin ETFs are accelerating institutional adoption and strengthening market credibility. The NYSE marked a new milestone as Morgan Stanley Investment Management rang the closing bell and celebrated the launch of MSBT, which the NYSE described as the first spot bitcoin ETF by a major
Coinpedia5h ago
BTC falls 0.49% in 15 minutes: fragile long leverage and active sell-off pressure resonate to weigh on the short term
From 18:00 to 18:15 (UTC) on 2026-04-17, the BTC price fluctuated and trended downward within the 77097.4 to 77573.2 USDT range. Over these 15 minutes, the return rate recorded -0.49%, and the amplitude reached 0.61%. During this period, market trading was active; short-term volatility was amplified, and trading attention increased significantly. The main driver behind this abnormal move is that the overall leverage structure is bearish and long positions are fragile. At present, the BTC perpetual contract funding rate has remained negative for 11 consecutive days, indicating that the bears have the upper hand in the market. In addition, futures open interest (OI) is about 628.3 billion USDT, which is at a historical high. During the anomaly window, trading volume increased noticeably. On-chain data shows large amounts of BTC flowing from long-term holder addresses to exchanges, suggesting that active sell orders may have triggered longs to passively reduce positions, amplifying downward price pressure. Moreover, institutional positioning enthusiasm in the mainstream contract market has cooled off; liquidity boundaries have tightened, causing large-trade activity to have an amplified effect on market volatility. In the options market, implied volatility rose to 39.81%, increasing demand for downside protection and reflecting a defensive posture among market participants. Macro-environment volatility and some capital flowing into safe-haven assets, together with the recent regulatory uncertainty-related historical events, reinforced the move, pushing overall market risk appetite lower. Current BTC leverage risks still remain. If, in the future, there are concentrated sell-offs, volatility may be further amplified. It is recommended to continue monitoring sustained high OI levels, the persistence of negative funding rates, and on-chain transfers of large amounts of funds, and to stay alert for whale behavior and any disruptions to market sentiment caused by macro-policy developments. For subsequent price action, please watch key support levels, institutional and whale on-chain moves, and relevant global market news, and guard against short-term risks.
GateNews7h ago
Bitcoin Liquidations Hit $815M as BTC Surges Above $78K Amid Iran Strait Opening
Over $815 million in leveraged cryptocurrency positions were liquidated recently, mainly due to short positions against Bitcoin. Markets improved as Iran reopened the Strait of Hormuz and Trump hinted at a deal with Iran, boosting Bitcoin prices significantly.
GateNews7h ago
