Bitcoin (BTC) has been stuck in a sideways range for two consecutive weeks, hovering between two key levels of $60,000 and $72,000. At the time of writing, BTC is trading around $68,000, with slight short-term recovery signals.
However, the overall market sentiment remains bleak as the fear index is at an extreme level. Despite major institutions continuing to adhere to a “buying” strategy despite temporary losses, the risk of sharp short-term volatility still exists and has not diminished.
Coin Photon warns that traders rushing to open long positions may fall into a “long squeeze” trap. This pressure comes from the increasing volume of highly leveraged long positions, amid a continued skew in the long/short ratio during the prolonged accumulation phase.
The ongoing developments could push the market into extreme tension — a familiar scenario often considered a necessary condition for forming a long-term bottom in the next cycle.
Bitcoin Has Not Yet Experienced a “Complete Purge”
For nearly three years, the Sales Pressure signal has almost disappeared from the on-chain picture, while Bitcoin’s price has remained steady above the realized price of $54,800. Notably, the number of days without strong network pressure has set a new record with 1,133 consecutive days, according to crypto analyst Axel Adler Jr.
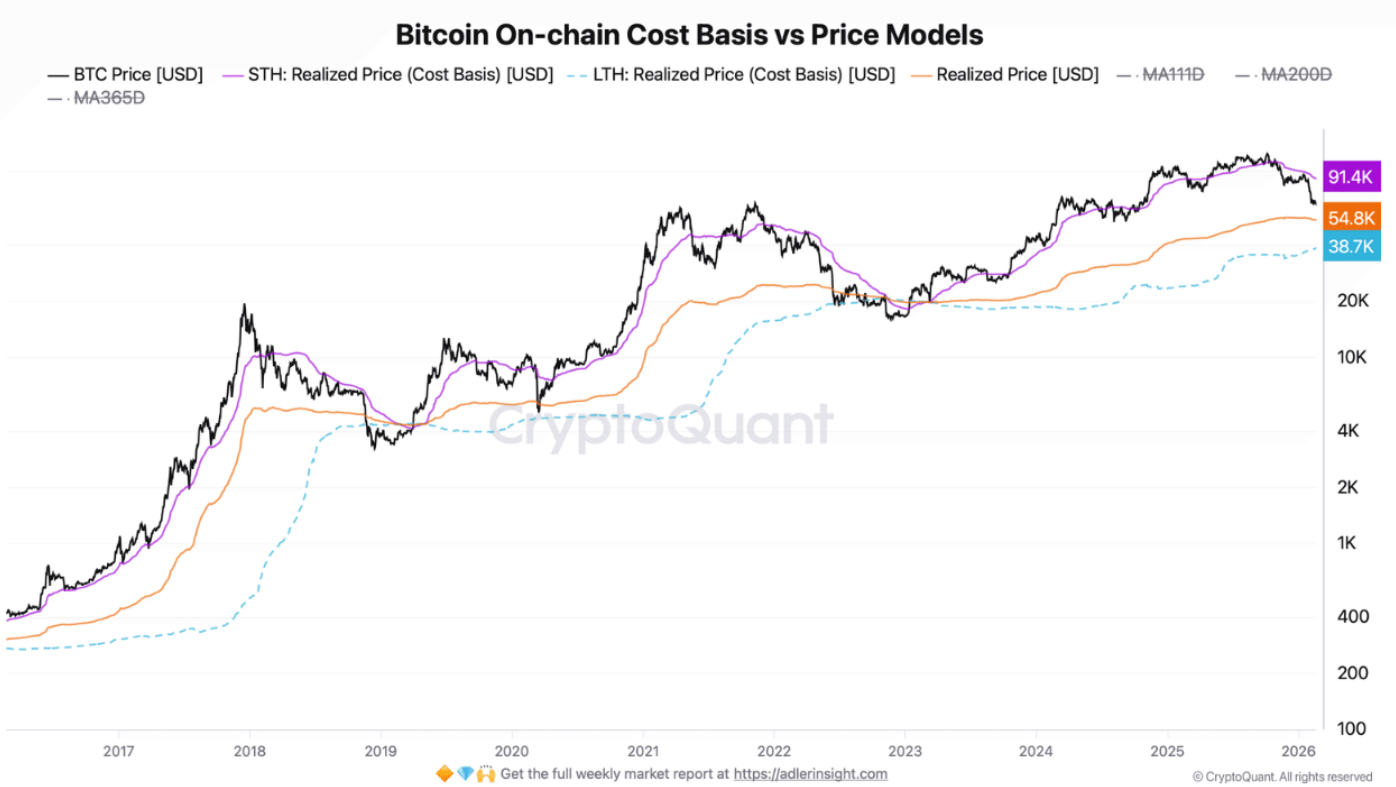 Source: Axel Adler Jr Insights He also points out three key on-chain cost thresholds that investors should pay close attention to:
- Short-term holder realized price: $91,400
- Network-wide realized price: $54,800
- Long-term holder realized price: $38,700
Among these, the $54,800 level acts as a “life or death” boundary for cycle risk assessment. If Bitcoin’s price decisively drops below this level, the market’s average position will turn into a loss, triggering the Sales Pressure indicator and signaling a phase of extreme network stress.
Currently, the market is still leaning toward a bearish trend. However, long-term holders are still in profit, and the extreme tension phase has not yet truly begun.
The $54,800 level thus becomes a high-risk but decisive zone — not only as a measure of network health but also as a region that has historically served as a crucial support in previous Bitcoin cycles.
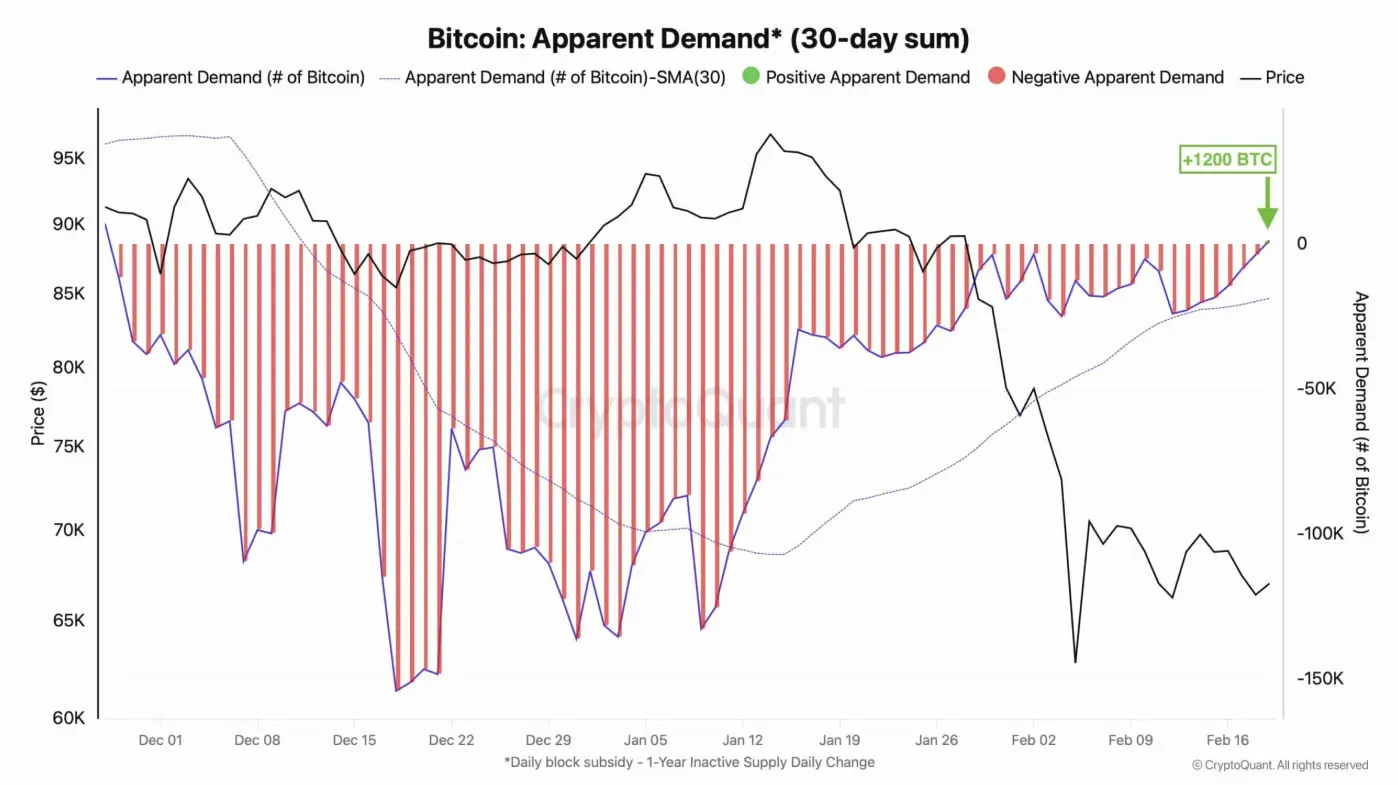 Source: Darkfost In another development, in a post on X, analyst Darkfost stated that monthly Bitcoin accumulation demand has returned to positive territory after nearly three months of weakness.
This is seen as an early signal that, despite long-term market challenges, structural accumulation forces have begun to strengthen enough to absorb new supply.
However, to confirm a sustainable recovery cycle for BTC, the market still needs several more weeks of positive monthly accumulation to reinforce the belief that a trend reversal has truly taken hold.
SN_Nour
Disclaimer: The information on this page may come from third parties and does not represent the views or opinions of Gate. The content displayed on this page is for reference only and does not constitute any financial, investment, or legal advice. Gate does not guarantee the accuracy or completeness of the information and shall not be liable for any losses arising from the use of this information. Virtual asset investments carry high risks and are subject to significant price volatility. You may lose all of your invested principal. Please fully understand the relevant risks and make prudent decisions based on your own financial situation and risk tolerance. For details, please refer to
Disclaimer.
Related Articles
US recession odds near 50%: Can Bitcoin copy 2020 comeback gains?
Bitcoin (BTC) faces a new macro test as markets increasingly bet on the US entering recession in 2026.
Key points:
Bitcoin could face a new challenge in the form of its first recession after the COVID-19 crash.
US recession odds surge as BlackRock CEO Larry Fink warns over oil
Cointelegraph22m ago
Bitcoin’s Most Dangerous Pattern Just Triggered: Will BTC Dump to $26K Next?
Although bitcoin has already dumped by over 50% from its all-time high of over $126,000 marked in October to a multi-year low of $60,000, the asset’s troubles might not be over, warned Merlijn The Trader.
The popular analyst indicated that the “most dangerous bitcoin pattern just completed phase
CryptoPotato45m ago
Dogecoin Macro Chart Maps Out Possible Roadmap Following Bitcoin’s Lead
Dogecoin has a history of following patterns. Not always perfectly, but close enough that the repeats are hard to ignore. Bitcoinsensus’ laid out a macro chart that tracks DOGE’s cycles alongside Bitcoin’s, and the roadmap is pretty clear. The DOGE price is sitting at a spot that looks
CaptainAltcoin54m ago
Morgan Stanley enters bitcoin ETF race with market-leading low fee
Morgan Stanley plans to offer a spot bitcoin ETF at 14 basis points, undercutting competitors and potentially igniting fee competition in the market. This strategic pricing aims to attract investments by leveraging its vast wealth management network.
CoinDesk1h ago
