
Key Takeaways
-
Bitcoin has dropped into the $69K–$74.5K support zone for the first time in ~15 months.
-
BTC is down 23% over 30 days, cooling off from the $126K high.
-
BTC/GOLD continues to respect a long-term ascending triangle.
-
The 200-week MA (~21.81 on BTC/GOLD) remains the key momentum trigger.
-
Holding $69K keeps rebound chances alive; losing it risks deeper consolidation.
Bitcoin has entered a critical phase, sliding into a price zone that hasn’t been meaningfully tested in nearly 15 months. After weeks of steady selling pressure, BTC has dropped back into the $69,000–$74,500 support range—an area that previously acted as a strong base during March 2025.
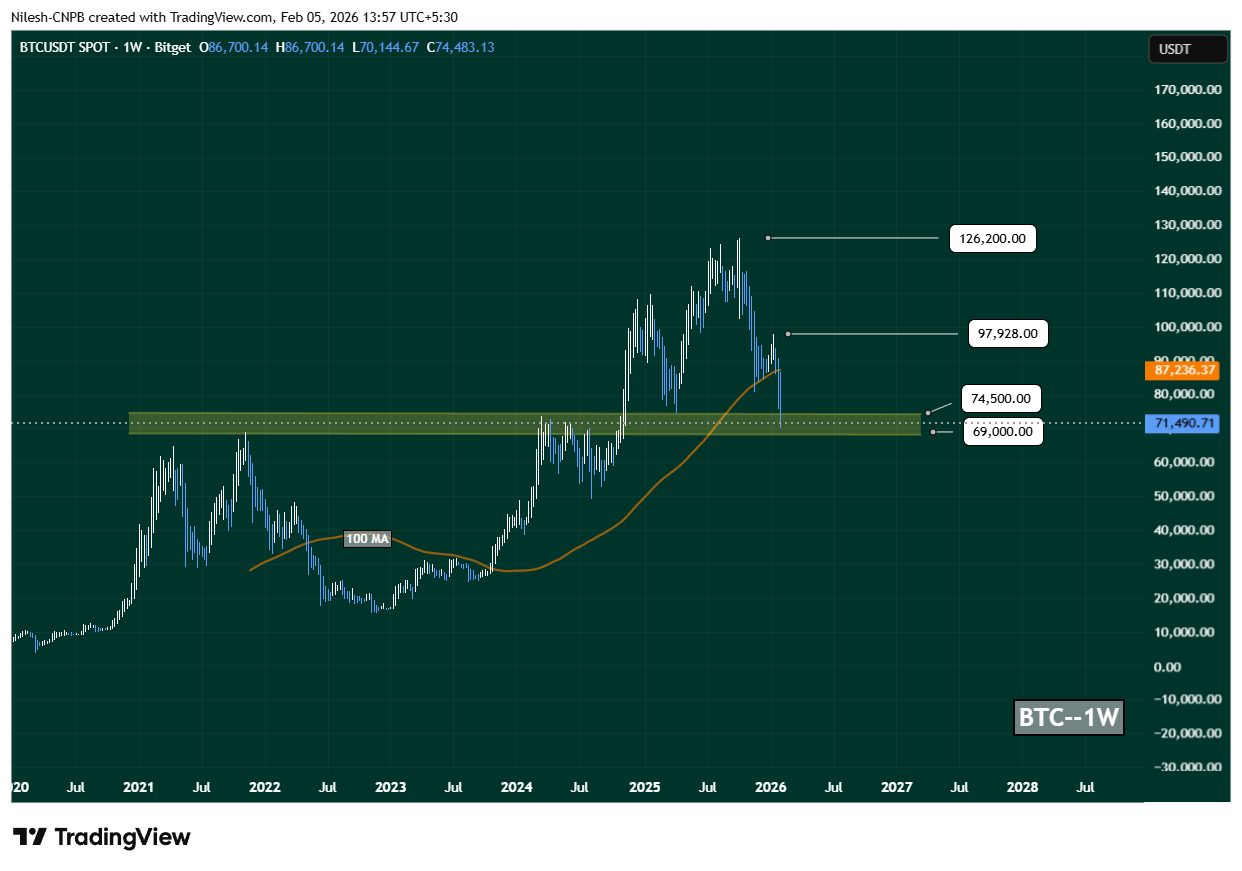
BTC Weekly Chart/Coinsprobe (Source: Tradingview)
As of February 5, 2026, Bitcoin is trading near $71,387, down 6.47% in the last 24 hours. On a broader scale, BTC is now off more than 23% over the past 30 days, giving back a large portion of its explosive rally toward the $126K all-time high and pushing market sentiment firmly back into caution mode.
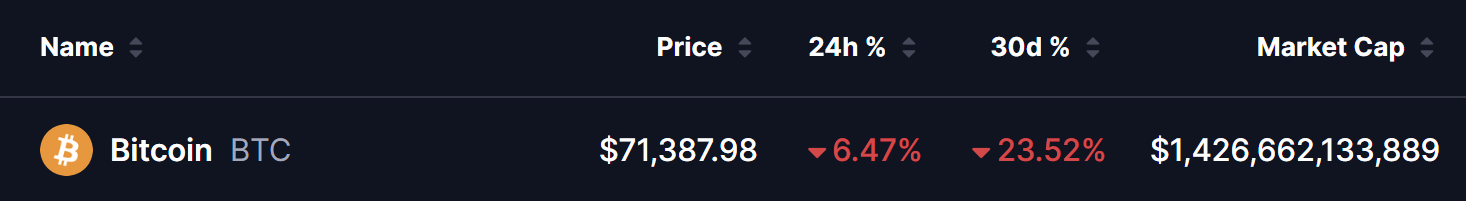
Source: Coinmarketcap
Still, from a technical perspective, Bitcoin is now sitting at a zone where rebounds have historically started.
Zooming out to the BTC/GOLD weekly chart, price action continues to respect a large ascending triangle structure—a pattern often associated with long-term trend reversals or bullish continuation.
This setup is defined by:
-
A rising trendline connecting higher lows all the way back to 2017
-
A horizontal resistance zone between 36.84 and 41.07, which has capped upside multiple times
During the recent gold-driven rotation, BTC/GOLD once again pulled back to test its long-term ascending support near 14.27—a level that has repeatedly acted as a major demand zone across multiple cycles.
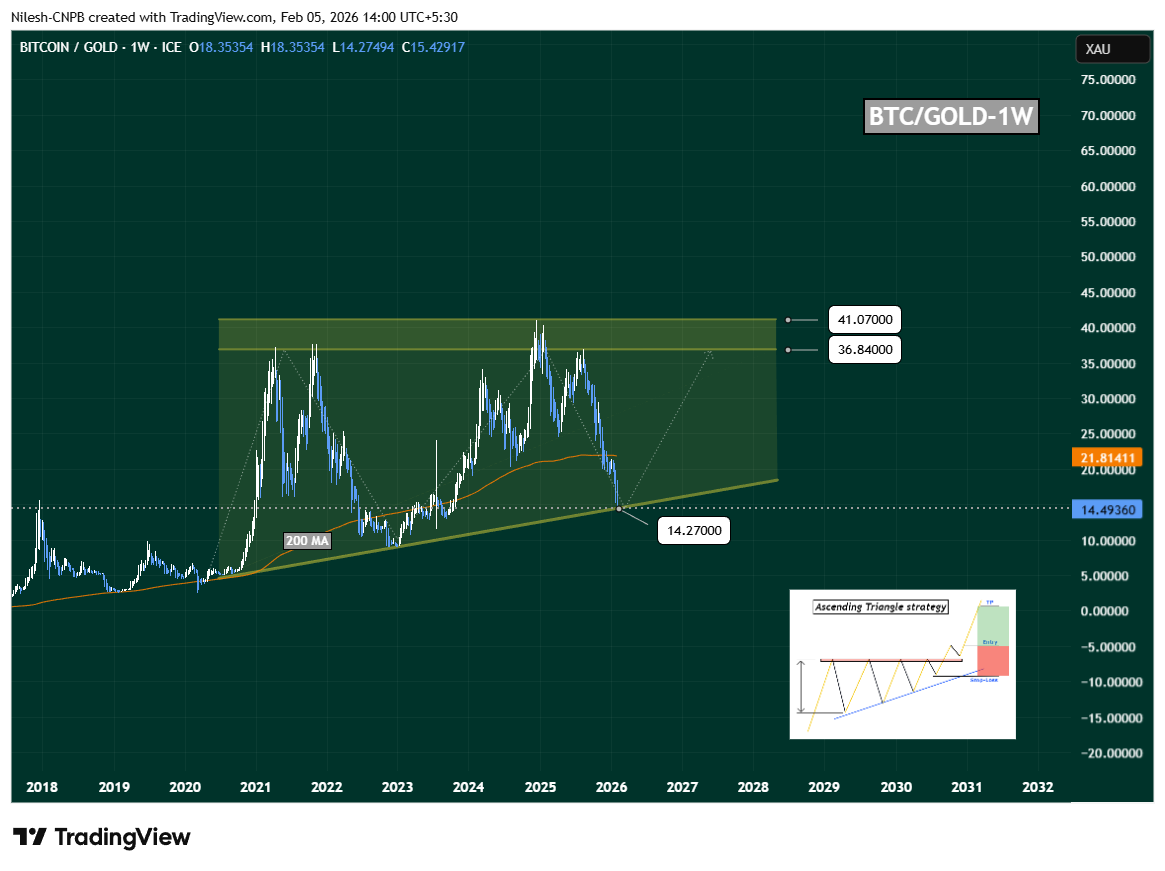
BTC/XAU Weekly Chart/Coinsprobe (Source: Tradingview)
Rather than breaking down, price respected this trendline.
That’s an important detail.
It suggests the current move looks more like a rotation inside the triangle, not a structural failure of the long-term bullish setup.
200-Week Moving Average Remains the Key Pivot
At present, BTC/GOLD is trading below its 200-week moving average, sitting near 21.81. Historically, this level has acted as a momentum switch:
A weekly or monthly reclaim of this moving average would be a strong signal that buyers are stepping back in and that Bitcoin may begin outperforming gold once again.
If that happens, momentum could accelerate quickly.
What’s Next for Bitcoin (BTC)?
Back on the BTC/USD weekly chart, price is now pressing directly into the $69K–$74.5K demand zone, while also interacting with the rising moving average.
If bulls manage to:
-
Hold this $69K–$74.5K support band, and
-
Stabilize price back above the weekly moving average,
Bitcoin could attempt a recovery toward:
-
$97,900 (first major resistance)
-
$126,200 (cycle high resistance)
This would mark a classic support defense → relief rally structure.
On the flip side, a clean weekly close below $69K would weaken the rebound thesis and open the door to deeper consolidation or another downside leg before any sustainable recovery.
Bottom Line
While traditional safe havens like gold are seeing sharp rotations, Bitcoin is quietly holding a major long-term support zone.
At the same time:
-
BTC/USD is testing a historical demand area
-
BTC/GOLD is respecting its ascending triangle
-
Momentum is stretched after a 23% monthly drawdown
This combination often precedes medium-term bounce attempts.
If support near $69K–$74.5K holds and BTC/GOLD reclaims its 200-week moving average, Bitcoin could be entering a phase where it begins to shine again—right as broader market fear peaks.
For now, BTC sits at a crossroads.
The next few weekly closes may decide whether this is just another correction… or the foundation for the next leg higher.
Disclaimer: The views and analysis presented in this article are for informational purposes only and reflect the author’s perspective, not financial advice. Technical patterns and indicators discussed are subject to market volatility and may or may not yield the anticipated results. Investors are advised to exercise caution, conduct independent research, and make decisions aligned with their individual risk tolerance.
About Author: Nilesh Hembade is the Founder and Lead Author of Coinsprobe, with over 5 years of experience in the cryptocurrency and blockchain industry. Since launching Coinsprobe in 2023, he has been providing daily, research-driven insights through in-depth market analysis, on-chain data, and technical research.
Disclaimer: The information on this page may come from third parties and does not represent the views or opinions of Gate. The content displayed on this page is for reference only and does not constitute any financial, investment, or legal advice. Gate does not guarantee the accuracy or completeness of the information and shall not be liable for any losses arising from the use of this information. Virtual asset investments carry high risks and are subject to significant price volatility. You may lose all of your invested principal. Please fully understand the relevant risks and make prudent decisions based on your own financial situation and risk tolerance. For details, please refer to
Disclaimer.
Related Articles
Under the Iran-U.S. conflict, the Bitcoin market is currently splitting: institutions continue to buy, while whales and mining firms are accelerating their sell-offs
Amid the impact of the U.S.-Iran geopolitical conflict, the Bitcoin market has diverged: institutional investors continue to accumulate Bitcoin, while whales, mining firms, and some countries are reducing their holdings. Data shows that large holders have shifted to net selling, mining firms’ sell-offs have been significant, and sovereign holders have also clearly cut exposure. Despite muted market sentiment, the price of Bitcoin has held in the $65k to $73k range, and its future direction will depend on continued inflows of institutional capital.
GateNews25m ago
CME Bitcoin futures open interest falls to $8.41 billion, hitting a 14-month low
Chicago Mercantile Exchange bitcoin futures open interest fell to a 14-month low. Driven by the unwinding of basis trades, institutions are leaning toward directly holding spot, and the leverage level in the futures market has dropped significantly.
GateNews1h ago
STRC This week’s fundraising is expected to be able to buy 8,000 BTC, or hold 10,000 coins
Gate News message. On April 11, Strategy's Stretch (STRC) has, to date this week, raised enough funds to purchase 8,000 BTC. It is estimated that STRC may hold 10,000 BTC by the end of this week.
GateNews2h ago
Bitcoin clings to $72K while 3.3% inflation and war‑driven oil spikes rattle US markets
US inflation rose 3.3% in March while Bitcoin traded back above $72,000, leaving crypto caught between sticky prices, war‑driven oil shocks and recurring liquidation waves.
Summary
Headline CPI increased 3.3% year‑on‑year and 0.9% month‑on‑month, driven by a roughly 10.9% jump in energy
Cryptonews2h ago
Morgan Stanley Bitcoin Trust Debuts With Low Fee Edge
Morgan Stanley's Bitcoin Trust (MSBT) launched with $34M in first-day trading, exceeding expectations. Its low 0.14% expense ratio positions it competitively in the market, attracting strong demand amid renewed investor interest and favorable geopolitical developments.
CryptoFrontNews3h ago
