Bitcoin Cash (BCH) is currently one of the few cryptocurrencies in the top 10 with a weekly price chart trending upward. Meanwhile, BNB was once considered a potential next candidate but has been under heavy pressure, experiencing a 54% decline over the past four months.
In contrast, BCH has maintained trading within a stable range for nearly 20 months. The price range fluctuates from $272 to $640, offering many attractive opportunities for swing traders.
According to a report from Coinphoton, long-term investors expect this range’s high to be broken and turned into support before considering participation in a stronger bullish trend. Although buyers attempted a breakout in early January, this effort was unsuccessful due to a market-wide sell-off that caused the price to reverse and correct.
However, currently, the Bitcoin Cash network appears to be maintaining a stable state. The significant increase in transaction volume along with active whale movements recently indicates strong on-chain liquidity circulation.
Short-term traders focus on the middle of the range to predict the next move
Since the second week of October, BCH price has touched below the support level in the middle of the $456 range three times on the weekly timeframe. However, no weekly close has fallen below this level, keeping the outlook positive.
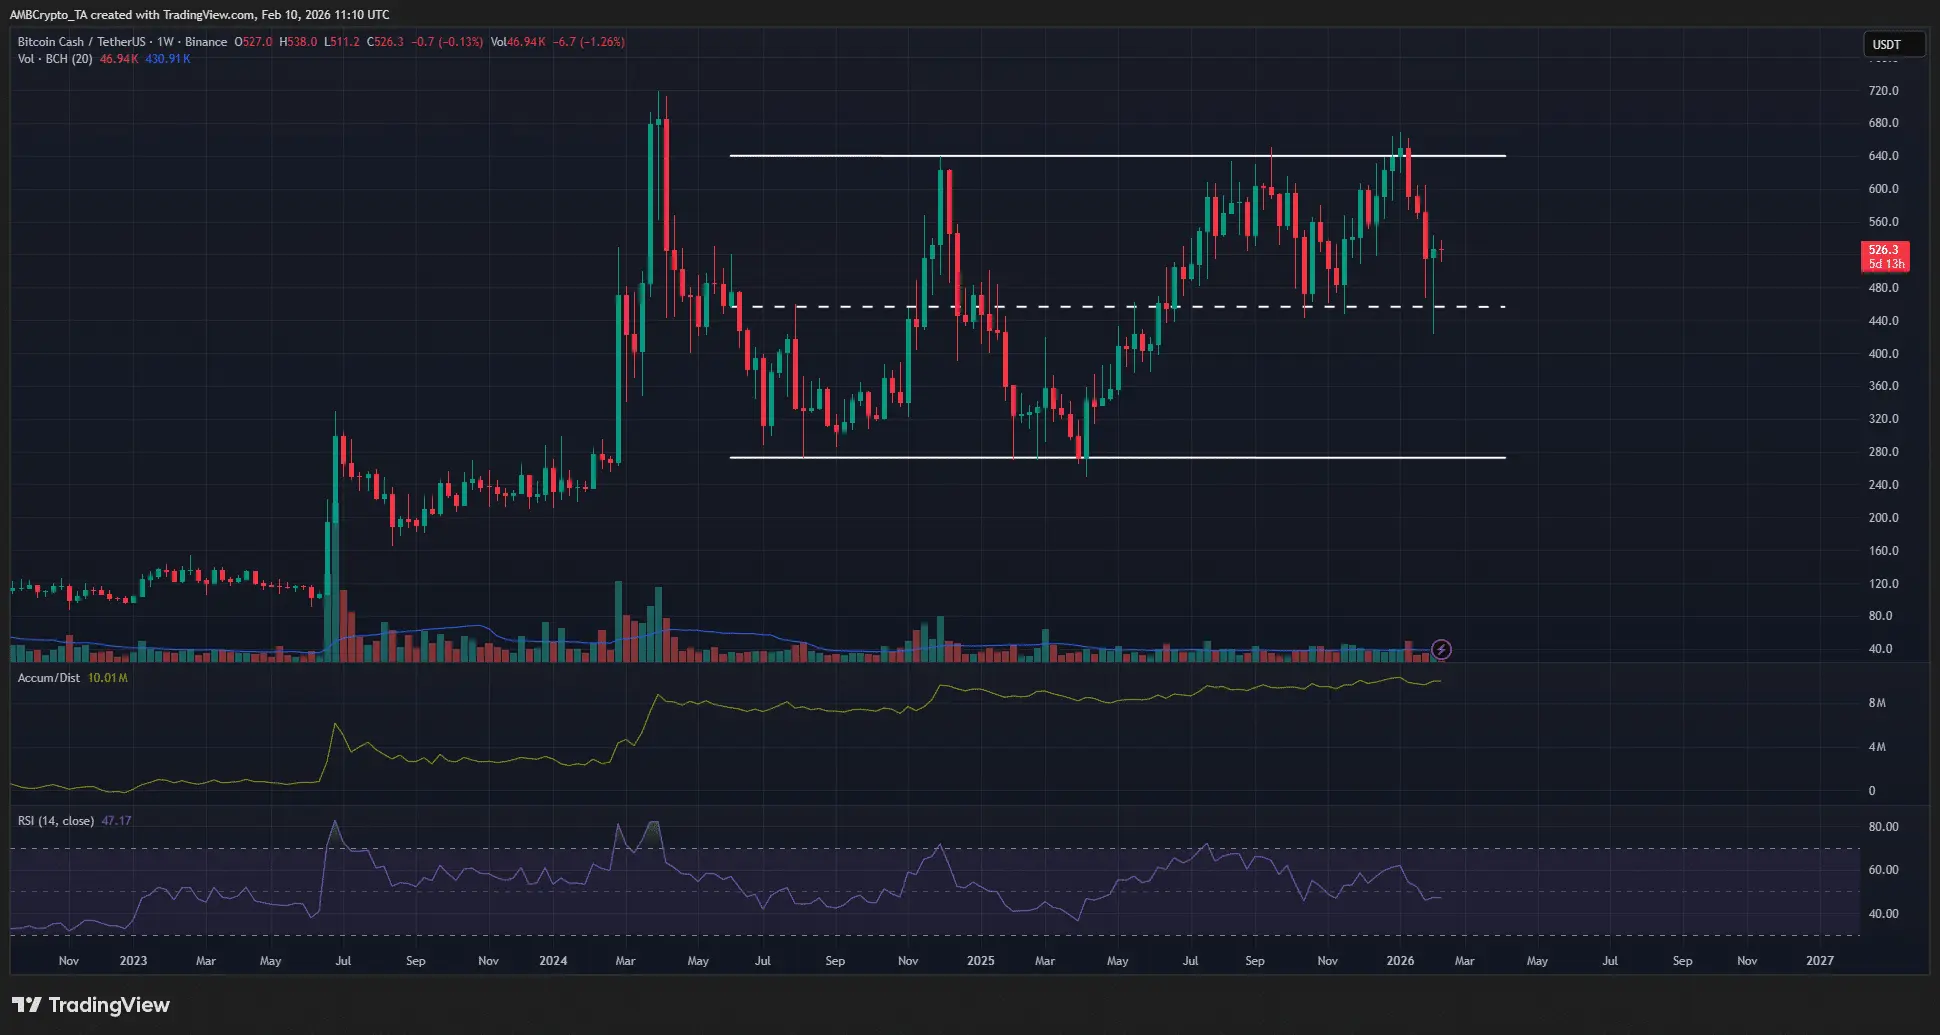 Source: TradingView The accumulation/distribution (A/D) indicator has maintained an upward trend since 2024, reflecting steady buying pressure. Additionally, the weekly RSI is currently at 47, indicating neutral momentum.
Combined with long-term price action, the $440–$460 zone is considered a low-risk, high-reward buying opportunity for investors.
Local supply zones may exert downward pressure
Liquidation heatmaps show that the $550 and $610 price levels are important nearby zones with significant potential to attract upward price movement before a reversal occurs. Notably, the supply zone at $550 has accumulated liquidity over the past 10 days.
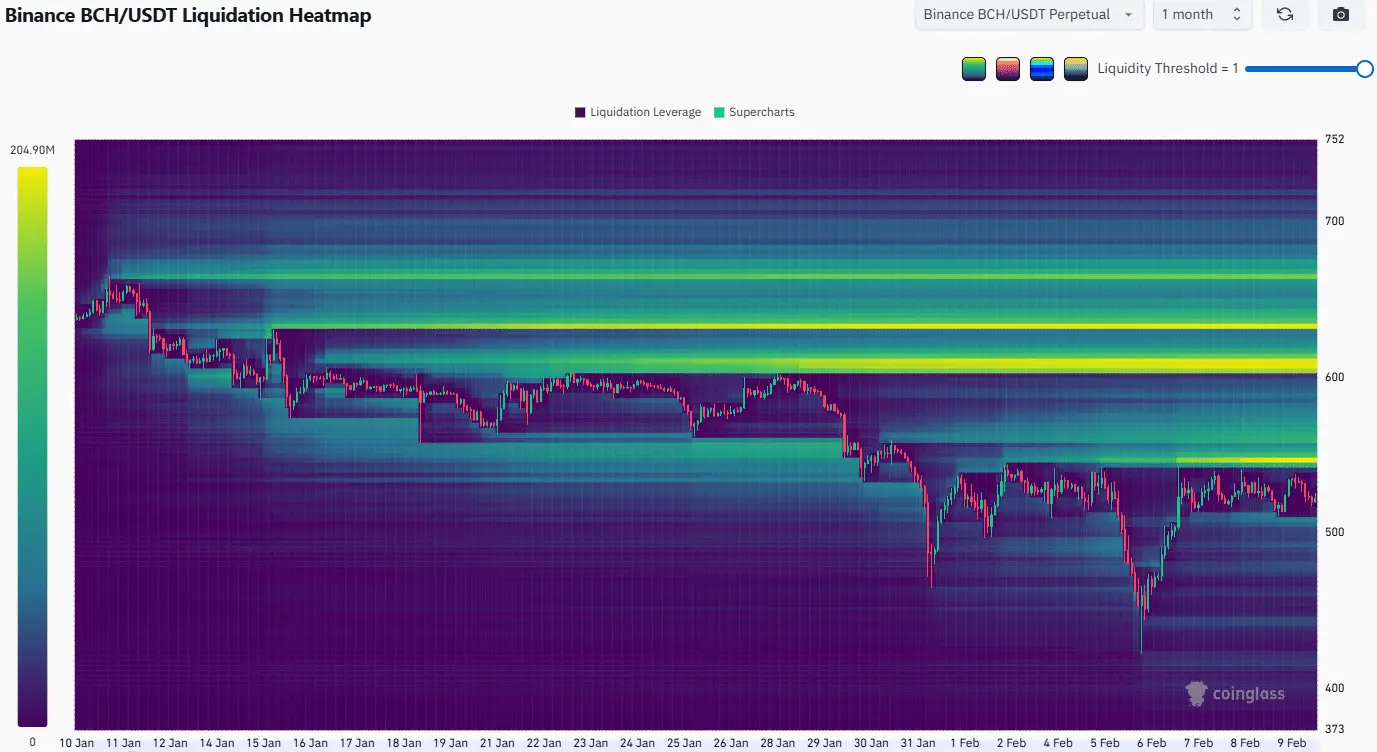 Source: CoinGlass Furthermore, the 4-hour chart indicates that BCH buyers have failed to break through the resistance at $540.
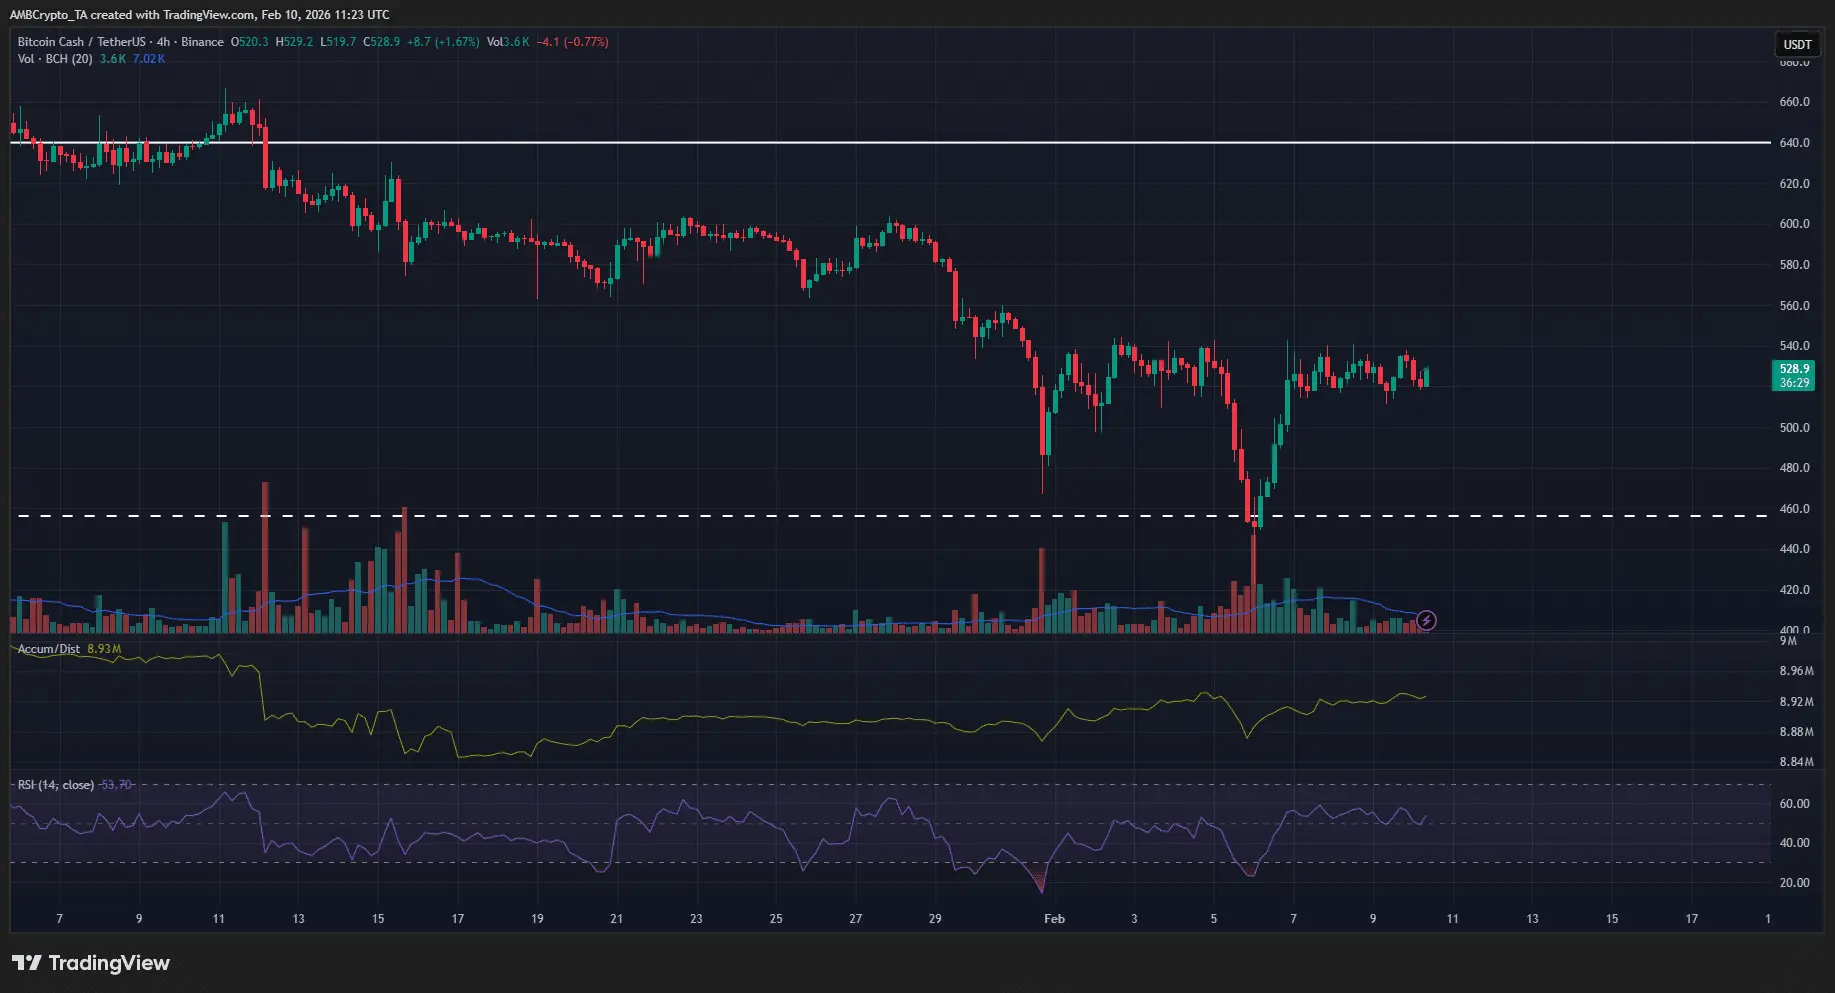 Source: TradingView Therefore, a possible scenario is that the price will be pushed higher in the short term to the $550–$560 zone before correcting downward to around $460. However, if BCH can break above $580, this scenario will be invalidated, opening the potential for a stronger rally.
Disclaimer: The information on this page may come from third parties and does not represent the views or opinions of Gate. The content displayed on this page is for reference only and does not constitute any financial, investment, or legal advice. Gate does not guarantee the accuracy or completeness of the information and shall not be liable for any losses arising from the use of this information. Virtual asset investments carry high risks and are subject to significant price volatility. You may lose all of your invested principal. Please fully understand the relevant risks and make prudent decisions based on your own financial situation and risk tolerance. For details, please refer to
Disclaimer.
Related Articles
XRP Faces Selling Pressure While Key Support Near $1.28 Holds
Key Insights:
XRP continues forming lower highs and lows, while price remains below major moving averages, reinforcing a sustained bearish structure across timeframes.
Open interest spikes during volatility signaled speculative trading, yet declining levels now reflect reduced risk
CryptoNewsLand1h ago
SHIB Holds Weak Range as Burn Rate Drops and Pressure Builds
Key Insights
SHIB remains within a long-standing descending channel, with price stuck in the lower range and unable to break persistent resistance levels.
The burn rate dropped sharply, removing a short-term support factor and reducing retail-driven momentum seen earlier during increased
CryptoNewsLand1h ago
HYPE Price Break Signals Deeper Pullback Amid Weak Momentum
Key Insights:
HYPE broke below $37 support after repeated tests, signaling weakening buyer strength and confirming growing bearish control across short-term price structure movements.
Fibonacci levels identify $32.44 and $29.5 as critical demand zones, where buyers may re-enter as
CryptoNewsLand1h ago
Solana Price Faces Downside Risk as Bears Eye $74 Zone
Key Insights
Solana trades near eighty dollars as bearish momentum builds, with indicators signaling weakness and increasing probability of testing lower support levels soon.
Technical signals, including weak MACD and low RSI momentum, indicate sellers remain dominant, reinforcing downside p
CryptoNewsLand1h ago
Dogecoin Sees Rising Long Bets While Price Stays Under Pressure
Dogecoin's long positioning increases as traders expect a rebound, yet significant short positions and declining trading volume suppress price movement. The market lacks direction, showing a sideways to slightly bearish outlook as the price struggles to gain momentum.
CryptoNewsLand2h ago
Dogecoin Eyes Breakout as Bollinger Bands Signal Price Shift
Key Insights:
Dogecoin trades near resistance as Bollinger Bands tighten, signaling reduced volatility and an increasing likelihood of a sharp directional price movement soon.
Declining trading volume reflects market hesitation, yet reduced selling pressure may still support upward
CryptoNewsLand2h ago
