
Key Takeaways
-
CC rallied over 169% before entering a healthy pullback.
-
Daily chart shows a confirmed cup-and-handle breakout.
-
Price is currently retesting key support near $0.16–$0.1677.
-
Holding this zone keeps upside targets at $0.188 → $0.275 in play.
-
Losing $0.16 would weaken the bullish setup.
The broader crypto market remains under pressure, with Bitcoin (BTC) and Ethereum (ETH) down more than 20% and 29% over the past 30 days. This wave of selling dragged most altcoins lower, but Canton (CC) stood out as a rare outperformer, recording a powerful 169% rally before entering a short-term pullback.
Even with today’s roughly 9% dip, CC continues to display a technically constructive structure, suggesting the recent weakness may simply be part of a healthy reset rather than the start of a deeper correction.
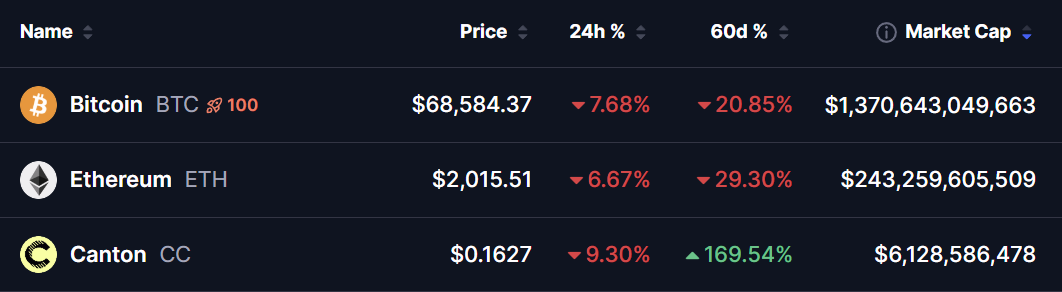
Source: Coinmarketcap
Cup-and-Handle Breakout Enters Retest Phase
On the daily chart, CC has completed a classic cup-and-handle formation, a bullish continuation pattern that often precedes strong upside expansion once confirmed.
Price formed a rounded bottom near $0.062 before consolidating into a descending handle structure. The breakout came as CC pushed above the neckline resistance around $0.16–$0.1677, triggering a sharp impulsive rally that carried price to a local high near $0.1881.
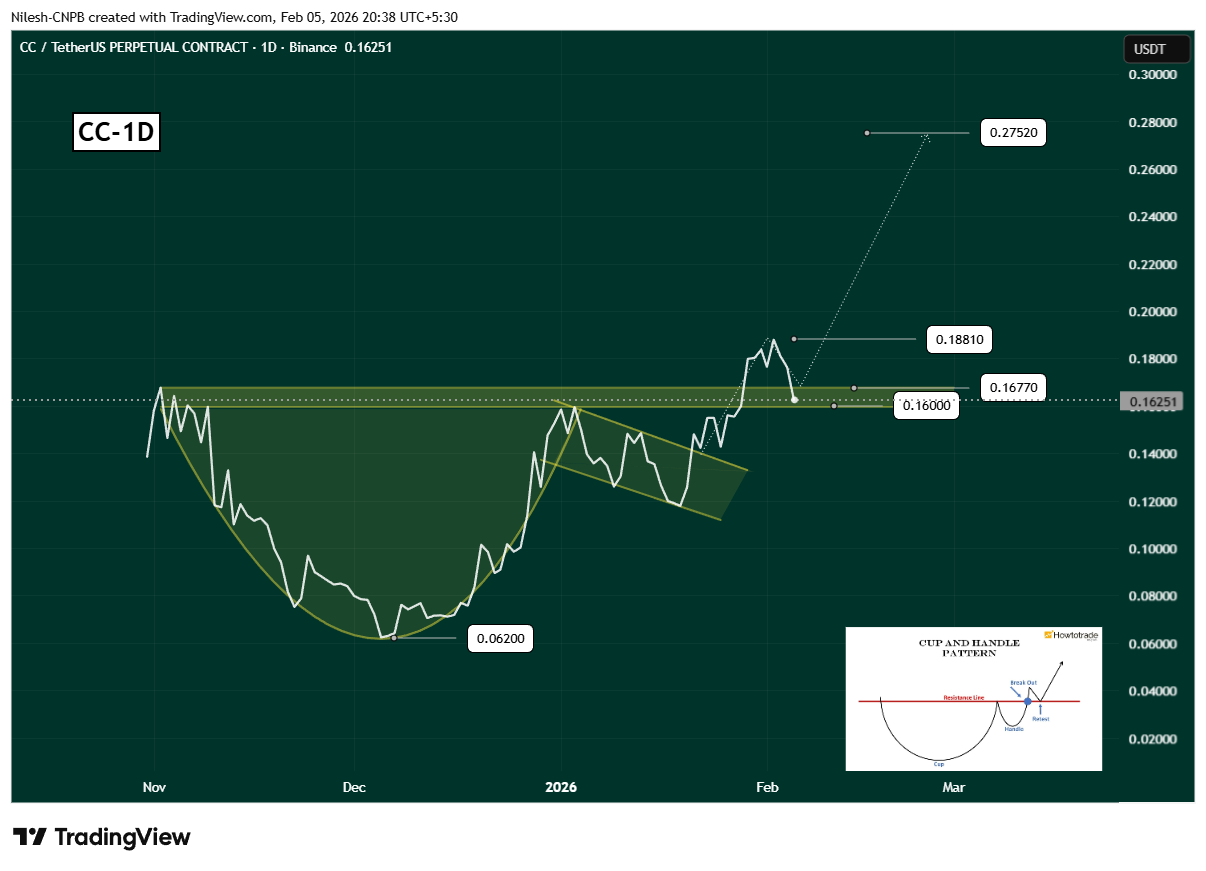
Canton (CC) Daily Chart/Coinsprobe (Source: Tradingview)
Following this move, CC entered a controlled pullback, returning to the former resistance zone that now acts as support. Price is currently hovering near the $0.162 region, directly inside the highlighted demand block on the chart. This area is technically important, as successful retests of breakout levels often act as launchpads for the next leg higher.
So far, the retracement remains orderly, which typically signals consolidation rather than distribution.
What the Chart Suggests Next for CC
The ongoing retest remains constructive as long as buyers continue to defend the $0.16–$0.1677 support band. A sustained hold in this zone would indicate that market participants are using the dip to accumulate rather than exit positions.
If bullish momentum resumes, the first milestone will be a reclaim of the $0.1881 local high. A decisive move above this level would confirm renewed strength and validate the breakout-retest structure.
Based on the measured move from the broader rounding bottom and cup formation, continuation from here could project CC toward the $0.2752 region. This aligns with the extension shown on the chart and represents roughly 69% upside from the breakout area.
However, if CC fails to maintain support above $0.16, the bullish setup would weaken significantly and raise the risk of a deeper pullback, potentially turning the breakout into a failed move.
Bottom Line
Despite today’s dip, Canton remains technically strong. The cup-and-handle breakout is still intact, price is retesting former resistance as support, and the overall structure continues to favor continuation while above $0.16.
In simple terms, as long as CC holds this demand zone and avoids aggressive rejection, the pullback looks more like a pause than a reversal — and the door remains open for another push higher toward the $0.188 and $0.275 regions.
Disclaimer: The views and analysis presented in this article are for informational purposes only and reflect the author’s perspective, not financial advice. Technical patterns and indicators discussed are subject to market volatility and may or may not yield the anticipated results. Investors are advised to exercise caution, conduct independent research, and make decisions aligned with their individual risk tolerance.
About Author: Nilesh Hembade is the Founder and Lead Author of Coinsprobe, with over 5 years of experience in the cryptocurrency and blockchain industry. Since launching Coinsprobe in 2023, he has been providing daily, research-driven insights through in-depth market analysis, on-chain data, and technical research.
Disclaimer: The information on this page may come from third parties and does not represent the views or opinions of Gate. The content displayed on this page is for reference only and does not constitute any financial, investment, or legal advice. Gate does not guarantee the accuracy or completeness of the information and shall not be liable for any losses arising from the use of this information. Virtual asset investments carry high risks and are subject to significant price volatility. You may lose all of your invested principal. Please fully understand the relevant risks and make prudent decisions based on your own financial situation and risk tolerance. For details, please refer to
Disclaimer.
Related Articles
PEPE Holds Tight Range as Bearish Pressure Limits Upside
Key Insights:
PEPE trades within a narrow consolidation range as sellers maintain control, while repeated resistance rejections prevent any sustained bullish momentum in the market.
Fibonacci resistance zones continue to cap upside potential, with multiple barriers aligning alongside
CryptoNewsLand16m ago
Shiba Inu Defies Bearish Setup as Short Squeeze Lifts Price
Key Insights
Shiba Inu price surged despite bearish death cross signals as short liquidations intensified, driving a rapid upward move during low liquidity conditions.
A dragonfly doji and tightening Bollinger Bands supported bullish momentum, reinforcing a reversal pattern after sustained d
CryptoNewsLand20m ago
Solana Recovery Gains Pace While Derivatives Data Shows Split Sentiment
Key Insights
Solana records four consecutive days of gains as funding rates rise, signaling stronger retail interest while overall market conviction remains divided across participants.
Declining futures Open interest alongside rising funding rates highlights reduced trader exposure,
CryptoNewsLand1h ago
Solana Eyes $90 as Volume Surge Fuels Short-Term Rally
Key Insights:
The Solana price rebounded from recent lows near $80 as trading volume surged sharply, signaling renewed participation and stronger short-term market momentum.
A golden cross on lower time frames reinforced bullish sentiment, with technical indicators suggesting continued
CryptoNewsLand1h ago
ETH 15-minute drop of 0.69%: Price pressure from declining burn volume and short-term capital arbitrage
2026-04-09 18:00 to 2026-04-09 18:15 (UTC), ETH closed down 0.69% within a 0.88% intraday trading range, with the price fluctuating between 2203.91 and 2223.58 USDT. Trading volume in this range rose slightly, market attention stayed high, but short-term volatility increased, prompting investor caution.
The main drivers behind this unusual move are that ETH on-chain Gas fees have fallen to historical lows, causing the EIP-1559 burn amount to decline. As a result, the net-supply contraction effect weakened, and the supply-demand structure faced adjustment pressure in the short term. Meanwhile,
GateNews1h ago
BTC drops 0.62% over 15 minutes: exchange net inflows intensify and short-term arbitrage converges to trigger volatility
From 18:00 to 18:15 on April 9, 2026 (UTC), the BTC price return recorded -0.62%, closing in the range of 71857.8 to 72375.1 USDT, with a trading range of 0.72%. Market attention was notably elevated, volatility intensified, and capital moved quickly within a short period. Overall market sentiment has become more cautious, and investors’ willingness to trade in the short term has increased.
The main driving force behind this abnormal move is an increase in net inflows to BTC exchanges during the anomaly window; the 10-minute net flow reached 755.92 BTC, indicating that some investors chose to transfer funds to exchanges to seek arbitrage opportunities in the midst of the volatility issue
GateNews1h ago
