Worldcoin (WLD), Canton (CC), and Jupiter (JUP) continue to maintain their upward momentum over the past 24 hours, despite the overall cryptocurrency market showing signs of stagnation following the Federal Reserve’s decision to keep interest rates unchanged announced on Wednesday. While Worldcoin is entering a short-term correction phase, Canton and Jupiter are approaching key resistance zones. From a technical perspective, the strongest performing assets of the day may face a reversal risk as selling pressure at resistance levels continues to increase.
Worldcoin loses momentum after 25% surge
Worldcoin (WLD) experienced a decline of about 5% on Thursday, as the price corrected back from the 100-day Exponential Moving Average (EMA) after a strong 25% breakout the previous day. The 50, 100, and 200-day EMAs remaining downward indicates that the bearish trend still dominates in the medium term.
In a negative scenario, if WLD continues to weaken and breaks below the 50-day EMA at $0.5547, selling pressure could intensify, pushing the price back to a key psychological support level around $0.5000.
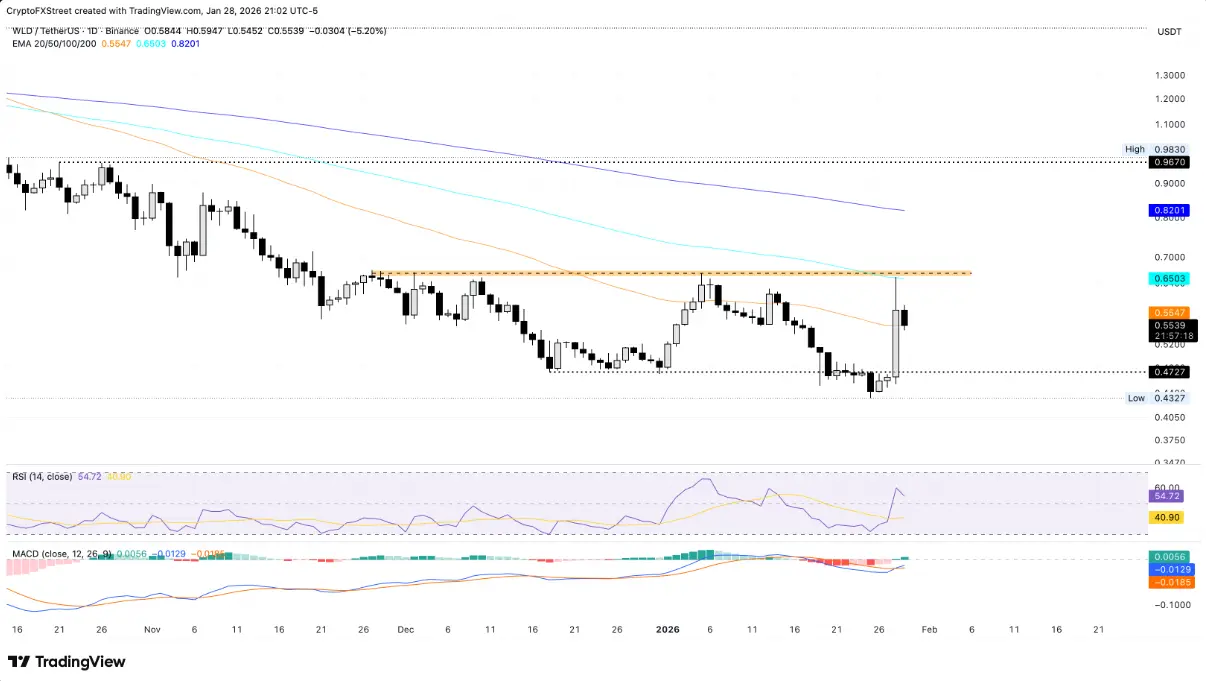 Daily WLD/USDT chart | Source: TradingViewOn the other hand, technical signals are beginning to show signs of improvement. The MACD histogram has shifted into positive territory as the MACD line crosses above the signal line near the zero mark, indicating increasing bullish momentum and the potential for an early recovery. Meanwhile, the Relative Strength Index (RSI) oscillates around 51, reflecting a neutral state and temporary market balance after recent strong volatility.
If WLD can break out and close stably above the 100-day EMA at $0.6503, the recovery momentum is likely to extend, with the next target around the 200-day EMA near $0.8201.
Canton at key resistance, aiming for upside targets
Canton is currently trading near a critical resistance zone at $0.1624, coinciding with the peak recorded on January 2nd. As of this writing, CC has risen slightly by 2% on Thursday, following a 2% increase on Wednesday, indicating stable buying pressure.
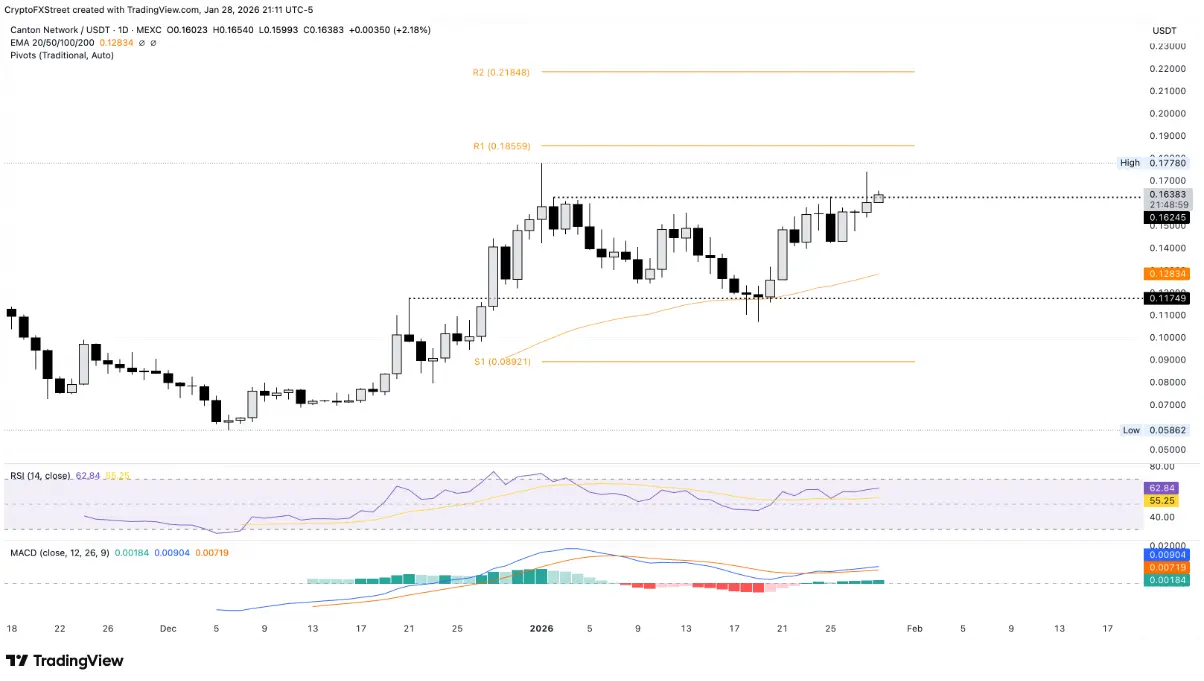 Daily CC/USDT chart | Source: TradingViewIf CC breaks above and closes convincingly above this level, the bullish trend is likely to target the R1 Pivot Point at $0.1855. The RSI remains sideways around 62, reflecting steady buying pressure and room for further gains before reaching overbought territory. Meanwhile, the MACD line and signal line continue to rise above zero, with expanding green histogram bars, confirming strong bullish momentum.
Conversely, if Canton drops below the round level of $0.1500, the 50-day EMA at $0.1283 will serve as an important support zone, helping to curb selling pressure.
Jupiter’s rally stalls at the 50-day EMA
Jupiter (JUP) is facing strong resistance at the 50-day EMA at $0.2174, after experiencing a 16% rally in the first three days of the week. As of now, JUP has declined nearly 1% on Thursday as pressure at the 50-day EMA increases.
If the current trading session closes below this level, the price could revisit the critical psychological level of $0.2000.
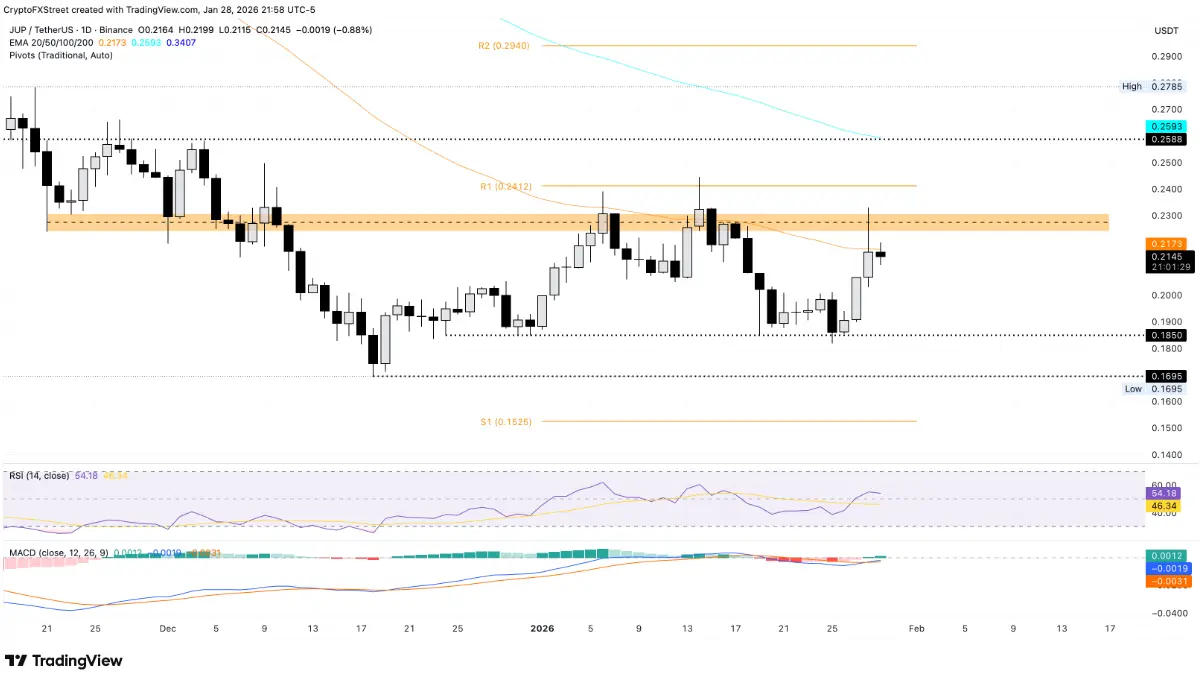 Daily JUP/USDT chart | Source: TradingViewFrom a technical standpoint, the MACD still signals a buy with a bullish crossover forming, while the RSI is at 54 and trending upward from the neutral zone, indicating that buying interest is gradually recovering after the previous rally.
If JUP breaks below the 50-day EMA, the next strong resistance zone between $0.2240 and $0.2308 could potentially control the upward movement.
Disclaimer: The information on this page may come from third parties and does not represent the views or opinions of Gate. The content displayed on this page is for reference only and does not constitute any financial, investment, or legal advice. Gate does not guarantee the accuracy or completeness of the information and shall not be liable for any losses arising from the use of this information. Virtual asset investments carry high risks and are subject to significant price volatility. You may lose all of your invested principal. Please fully understand the relevant risks and make prudent decisions based on your own financial situation and risk tolerance. For details, please refer to
Disclaimer.
Related Articles
XRP Today’s News: Institutional funds return, circulating inflow of 120 million exceeds Bitcoin
This week, XRP recorded a $119.6 million capital inflow, setting the highest mark since 2025 and becoming a major beneficiary in the crypto market. This round of funds returning was mainly driven by greater clarity in regulatory policy and XRP’s real-world use in cross-border payment infrastructure. Technically, it shows an initial recovery, but overall it is still in a downward channel. The support and resistance levels are $1.31 and $1.40, respectively; if it breaks through, it is expected to reach $1.50.
MarketWhisper2h ago
XRP drops to $1.33, with $3.32 million in ETF inflows still failing to reverse the downtrend; the key support to watch is $1.28
In April 2026, the XRP price pulled back to $1.33, down about 4%. Although there was capital inflow into Ripple-related products, selling pressure dominated the market, and increased trading volume signaled distribution. Declining liquidity further heightens volatility risk; watch the $1.33 support—if it breaks, prices will likely fall further. For a short-term rebound, it needs to break above $1.35; otherwise, it should remain in a weak range-bound consolidation.
GateNews2h ago
XRP Price Structure Signals More Downside — Key Levels to Watch
XRP fails to make new highs, confirming bearish market structure remains intact.
Price targets $1.13, $1.08, and potentially $0.87 support levels.
Traders should wait for confirmation instead of reacting to short-term price moves.
Short bursts of green candles can quickly shift market
CryptoNewsLand2h ago
Bitcoin is hovering around the $700,000 level; if oil prices fall below $100 or push toward $80,000
Bitcoin has recently been trading in a high-level range. The price rebounded from $67,000 to $70,900, driven by a U.S.-Iran ceasefire agreement. Market analysis suggests that weakness in oil prices—or easing inflation pressure—may support Bitcoin’s upside. If it breaks above $72,500, it could trigger short liquidations and push the price up to $80,000. However, instability in the Middle East and a rebound in oil prices could act as a drag. Volatility in the energy market will be a key factor influencing Bitcoin’s direction.
GateNews2h ago
Tom Lee: The stock market often hits bottom early in a war, bullish on Ethereum and tech stocks
Well-known analyst Tom Lee said in an interview that despite the U.S.-Iran conflict and rising oil prices, the stock market did not fall, showing that the market has strong resilience. He believes that most S&P constituents have undergone significant adjustments, that the worst-case scenario for the overall market may already be behind us, and that there is room for upside from here. He is bullish on Ethereum as well as technology, industrial, and mid- and small-cap stocks.
GateNews3h ago
Michael Saylor: Bitcoin may have already hit bottom, but quantum risks have been exaggerated
Strategy Executive Chairman Michael Saylor believes Bitcoin hit its bottom around $60,000 this February, because all forced sellers in the market have already exited. He said that the catalyst for the next bull market will be a bitcoin-based banking credit system, while he believes the threat from quantum computing is being exaggerated, and he pointed out that the technical community has enough time to deal with this threat.
MarketWhisper6h ago
