
Key Takeaways
-
Virtuals Protocol (VIRTUAL) is holding around 20% monthly gains despite short-term market weakness.
-
The 4H chart shows a developing inverse head and shoulders pattern, a classic bullish reversal structure.
-
Price recently faced rejection near the $0.85 neckline, suggesting the right shoulder is still forming.
-
A potential dip toward the $0.78 support zone could complete the pattern and attract buyers.
-
A confirmed breakout above $0.85 may open the door for a stronger upside move, while losing $0.78 could delay the bullish setup.
Virtuals Protocol (VIRTUAL), the native token of the decentralized infrastructure and launchpad powering autonomous AI agents, has been holding up relatively well despite recent market-wide hesitation. The token is still sitting on around 20% monthly gains, although it is trading slightly in the red today in line with broader crypto sentiment.
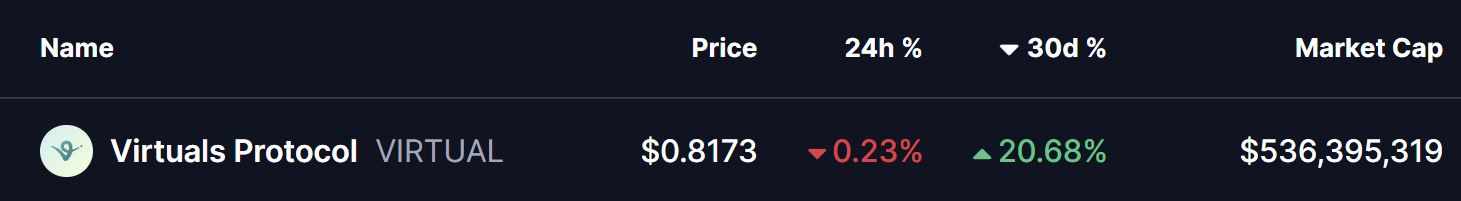
Source: Coinmarketcap
However, when you zoom into the chart, the price action tells a more interesting story. Beneath the short-term weakness, VIRTUAL appears to be building a classic bullish reversal structure, one that could act as the base for a stronger upside move if confirmed.
Inverse Head and Shoulders Pattern Takes Shape
On the 4-hour timeframe, VIRTUAL has carved out a clear inverse head and shoulders pattern, a formation often associated with trend reversals after a prolonged pullback.
-
The left shoulder developed near the $0.80 zone, where buyers initially stepped in.
-
This was followed by a deeper decline toward $0.75, forming the head of the structure and marking the local low.
-
Price then rebounded toward the descending neckline resistance around $0.85, where it faced rejection once again.
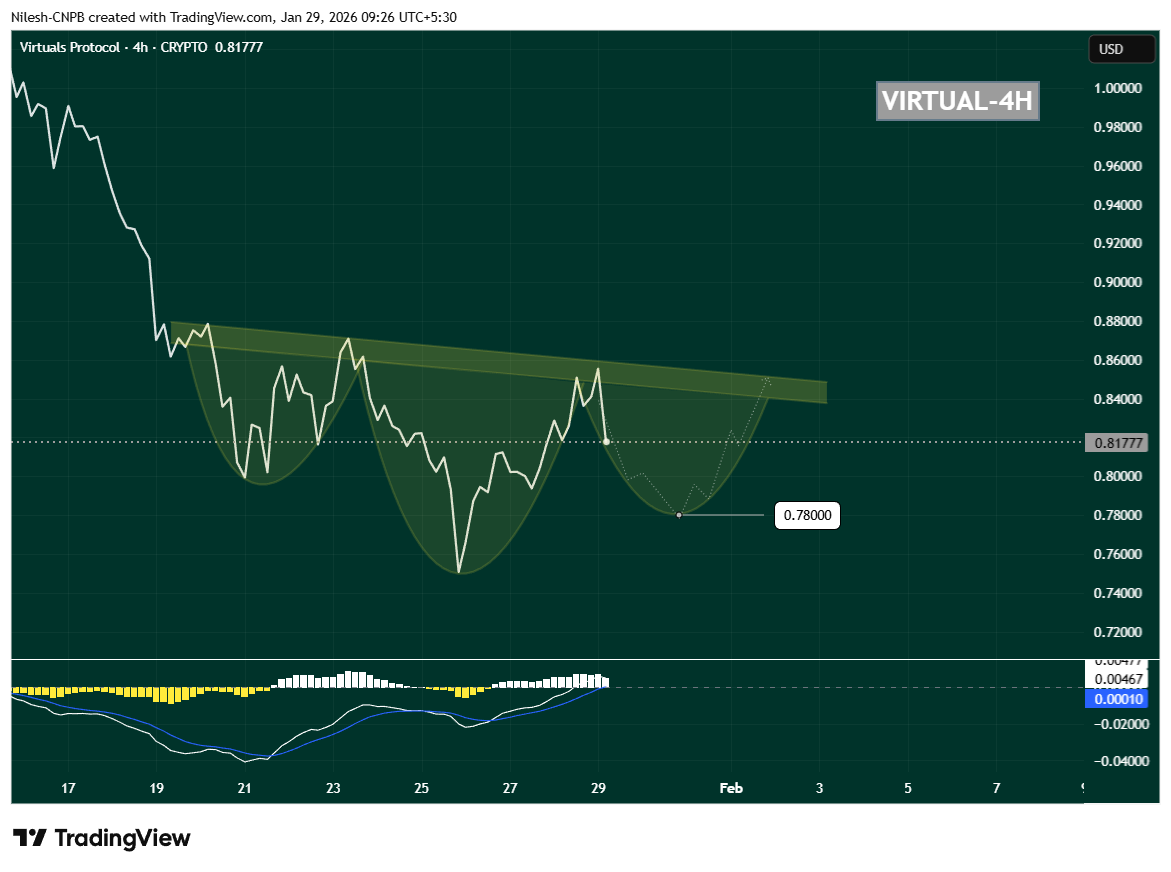
VIRTUAL 4H Chart/Coinsprobe (Source: Tradingview)
Following this rejection, VIRTUAL has started to drift lower and is currently trading near $0.8177, suggesting that the right shoulder may still be forming. This behavior fits well with the textbook structure of the pattern and keeps the bullish setup technically valid for now.
Momentum Signals Support the Setup
Momentum indicators are also worth watching closely. On the same timeframe, the MACD is cooling off and curling downward, reflecting short-term weakness rather than a full trend breakdown. In many cases, this kind of MACD reset during right-shoulder formation actually helps fuel the next impulsive move higher once buyers regain control.
As long as selling pressure remains controlled and price avoids a sharp breakdown, this momentum reset can work in favor of the bulls.
What’s Next for VIRTUAL?
If the pattern continues to play out, VIRTUAL could dip toward the $0.78 region, which aligns well with the projected right-shoulder bottom visible on the chart. This zone may act as a critical demand area where buyers look to step back in.
A strong bounce from this region, followed by renewed buying pressure, would increase the probability of a bullish breakout attempt toward the $0.85 neckline. A clean move above this resistance would confirm the inverse head and shoulders pattern and signal a potential shift back into a short-term uptrend.
On the downside, losing the $0.78 support decisively would weaken the structure and delay the bullish thesis, potentially opening the door for deeper consolidation.
For now, VIRTUAL is at a key technical crossroads. The structure remains constructive, the pattern is intact, and the chart suggests that the next major move—up or down—could arrive once this right shoulder finishes forming. Traders will be watching closely how price reacts around support in the coming sessions.
Disclaimer: The views and analysis presented in this article are for informational purposes only and reflect the author’s perspective, not financial advice. Technical patterns and indicators discussed are subject to market volatility and may or may not yield the anticipated results. Investors are advised to exercise caution, conduct independent research, and make decisions aligned with their individual risk tolerance.
About Author: Nilesh Hembade is the Founder and Lead Author of Coinsprobe, with over 5 years of experience in the cryptocurrency and blockchain industry. Since launching Coinsprobe in 2023, he has been providing daily, research-driven insights through in-depth market analysis, on-chain data, and technical research.
Disclaimer: The information on this page may come from third parties and does not represent the views or opinions of Gate. The content displayed on this page is for reference only and does not constitute any financial, investment, or legal advice. Gate does not guarantee the accuracy or completeness of the information and shall not be liable for any losses arising from the use of this information. Virtual asset investments carry high risks and are subject to significant price volatility. You may lose all of your invested principal. Please fully understand the relevant risks and make prudent decisions based on your own financial situation and risk tolerance. For details, please refer to
Disclaimer.
Related Articles
Shiba Inu Price Compression Signals Imminent Breakout Phase
Key Insights:
Shiba Inu trades near $0.0000060 as tightening volatility and reduced momentum signal an approaching breakout phase after months of sustained decline.
Open interest declines to $68 million, while persistent spot outflows highlight cautious sentiment and limited conviction
CryptoNewsLand5m ago
XRP Price Nears $1.50 Breakout as Triangle Tightens
Key Insights:
XRP consolidates within a symmetrical triangle, with tightening price action suggesting a potential breakout toward higher resistance levels as bullish momentum continues building.
Supertrend turning green and MACD rising indicate increasing buying pressure, supporting a bullis
CryptoNewsLand8m ago
Solana Price Holds Range as $90 Resistance Caps Breakout
Key Insightsthe price
Solana trades between $85 and $86 after a pullback, while an ascending channel pattern supports bullish structure with strong demand near support levels.
Momentum indicators, including MACD and Aroon, suggest strengthening buying pressure, reinforcing expectations of a
CryptoNewsLand13m ago
CryptoQuant Analyst: Bitcoin Must Hold Above $83K to Confirm Market Recovery
Gate News message, April 26 — According to CryptoQuant analyst Axel Adler, short-term holder (STH) selling pressure has notably eased following spring market stress relief, and Bitcoin's market recovery remains underway. Current BTC price has approached the short-term holder cost basis.
Adler
GateNews3h ago
XRP Market Shows Leverage Reset Amid Divergence Between Derivatives Pressure and Spot Strength
Gate News message, April 26 — XRP's market structure is displaying signs of significant repositioning, with data showing a complex divergence between derivatives and spot activity. According to market analysis, leveraged longs on major CEX perpetuals are being unwound even as spot price remains
GateNews4h ago
Bitcoin Perpetual Contracts: Large Holders Earn Fees While Retail Traders Pay, Says Chief Economist
Gate News message, April 26 — Fu Peng, newly appointed chief economist at Xinhuojituan, explained the underlying business model of Bitcoin perpetual contracts on social media, comparing it to traditional finance's "deferred fees" or "overnight fees" used in precious metals and commodity spot
GateNews5h ago