Key Takeaways
-
Avalanche (AVAX) has dropped over 16% in the past week, reflecting broader market weakness.
-
The 4H chart shows a Bullish Shark harmonic pattern, often associated with trend reversals.
-
Price is currently hovering near the $11.88 support, a critical zone for pattern validation.
-
If support holds, AVAX could rebound toward $13.39, with a higher upside target near $14.94.
-
A breakdown below the current support would invalidate the bullish setup and extend downside risk.
The cryptocurrency market remains under notable selling pressure as the total crypto market capitalization slipped 1.79% over the past 24 hours. This broader pullback triggered heightened volatility across digital assets, leading to more than $807 million in liquidations, with long positions bearing the brunt of the losses.
This wave of downside pressure has spilled into major altcoins, including Avalanche (AVAX). The token is trading slightly in the red and has dropped over 16% in the past seven days. However, beyond the red candles, AVAX’s chart is beginning to reveal a technical structure that suggests downside momentum may be weakening — and a rebound could be forming.
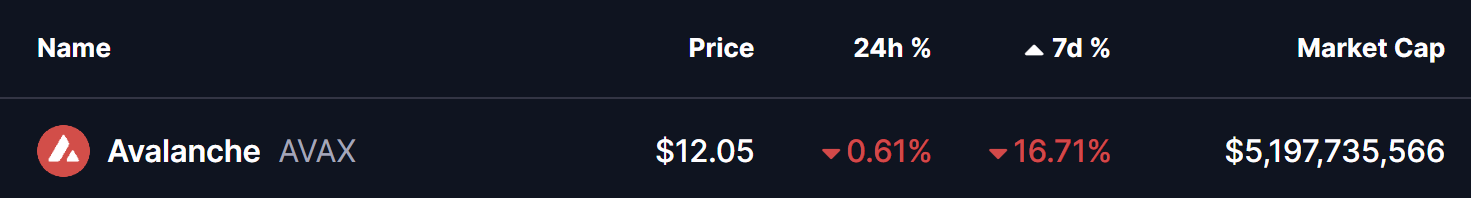
Source: Coinmarketcap
Harmonic Pattern Hints at Potential Upside
On the 4-hour timeframe, AVAX appears to be completing a Bullish Shark harmonic pattern, a formation that often emerges near market lows when selling pressure becomes exhausted. This pattern typically signals a potential trend reversal once its final leg forms within a defined demand zone.
The structure began with the initial O–X impulse around the $12.22 area, followed by a sharp rally that peaked near $14.83 at point X. Price then retraced aggressively toward point A before making another push higher to form point B near $14.94. That move, however, failed to sustain, triggering the current corrective leg.
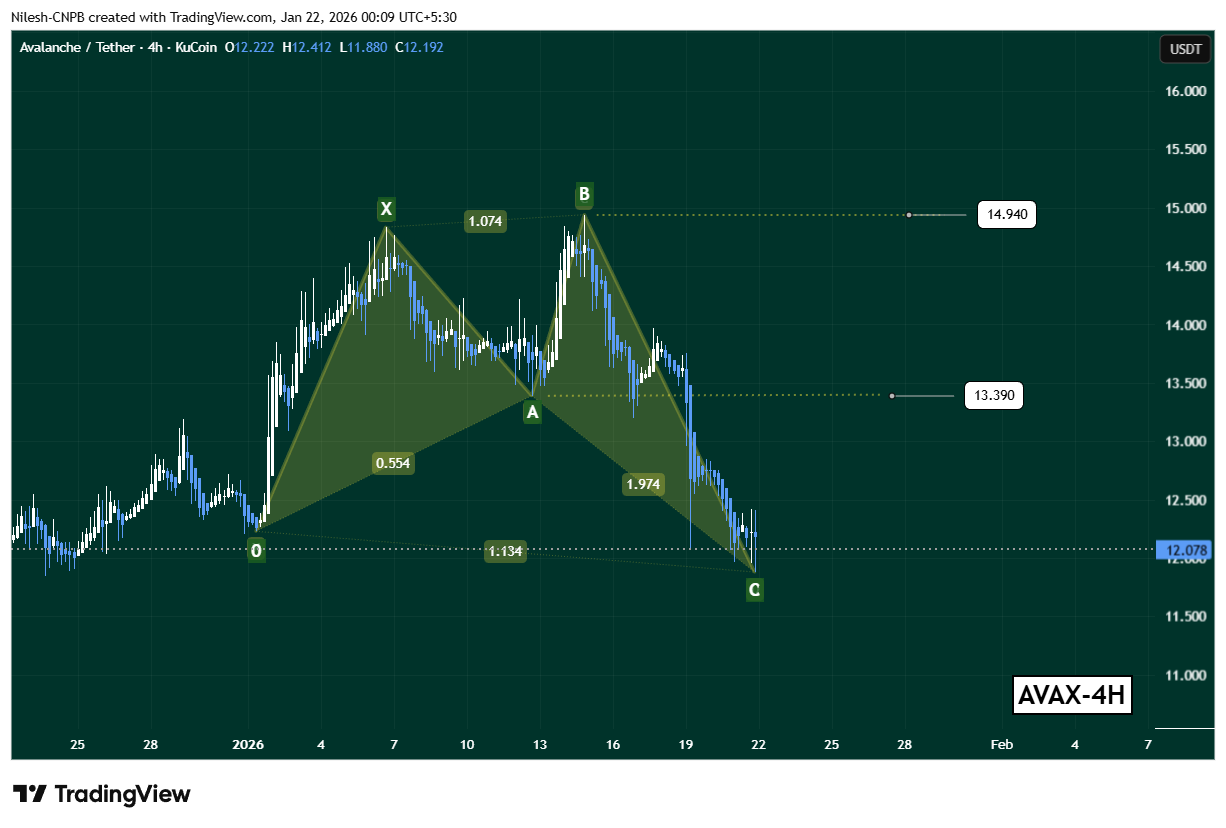
Avalanche (AVAX) 4H Chart/Coinsprobe (Source: Tradingview)
AVAX has since slid steadily lower, with price now hovering near $11.88, a level that could represent the C-point completion of the Shark pattern. This zone is technically important, as it’s where buyers often step in if the pattern is to play out bullishly.
What’s Next for AVAX?
If this harmonic structure continues to unfold as expected, AVAX could be positioning for a rebound from current levels. The first key upside level to watch sits around $13.39, which aligns closely with the prior A-point of the formation and serves as a near-term recovery target.
A stronger bullish follow-through could eventually bring the $14.94 region back into focus — the B-leg high and a significant resistance zone where sellers previously stepped in.
That said, the bullish outlook remains conditional. A sustained breakdown below the $11.88 support zone would invalidate the Shark pattern and shift momentum back in favor of the bears, opening the door for further downside continuation.
Bottom Line
AVAX may still be under pressure, but the emerging Bullish Shark harmonic pattern suggests selling momentum could be nearing exhaustion. As long as price holds above the current support zone, the setup favors a short-term rebound toward $13.39 and potentially $14.94. However, confirmation will depend on buyer response at current levels — making the next few sessions critical for Avalanche’s near-term direction.
Disclaimer: The views and analysis presented in this article are for informational purposes only and reflect the author’s perspective, not financial advice. Technical patterns and indicators discussed are subject to market volatility and may or may not yield the anticipated results. Investors are advised to exercise caution, conduct independent research, and make decisions aligned with their individual risk tolerance.
About Author: Nilesh Hembade is the Founder and Lead Author of Coinsprobe, with over 5 years of experience in the cryptocurrency and blockchain industry. Since launching Coinsprobe in 2023, he has been providing daily, research-driven insights through in-depth market analysis, on-chain data, and technical research.
Disclaimer: The information on this page may come from third parties and does not represent the views or opinions of Gate. The content displayed on this page is for reference only and does not constitute any financial, investment, or legal advice. Gate does not guarantee the accuracy or completeness of the information and shall not be liable for any losses arising from the use of this information. Virtual asset investments carry high risks and are subject to significant price volatility. You may lose all of your invested principal. Please fully understand the relevant risks and make prudent decisions based on your own financial situation and risk tolerance. For details, please refer to
Disclaimer.
Related Articles
7-Day AI Coin Performance Explodes — Are These 5 Tokens Worth Buying Right Now?
These tokens’ weekly performance reflects different degrees of stability, speculation, and maturity.
Social factors and interactions also contributed to short-term price dynamics.
Those with larger ecosystems appear to have more stable price movements than highly volatile assets.
There h
CryptoNewsLand44m ago
Trump delays the schedule of talks with the Middle East envoy, and Bitcoin slips modestly as geopolitical volatility eases
U.S. President Trump announced that the itinerary of the Middle East envoy, Wittekoff, and Kushner to Pakistan has been canceled, emphasizing that the U.S. side holds the negotiating initiative; Bitcoin fell in the short term due to the news, and analysts say it was due to a geopolitical risk premium, with market focus shifting to the Palm Beach crypto conference and future regulatory developments.
ChainNewsAbmedia50m ago
SUI Price Eyes $1.10 Breakout as Whale Positions Rise
Key Insights
SUI trades at $0.96 with RSI at 53.66, showing neutral momentum while maintaining upside room for expansion toward resistance levels.
Whale positioning at 70% long signals strong institutional confidence, aligning with rising open interest and steady capital inflows despite
CryptoNewsLand4h ago
PEPE Price Climbs as Bulls Test Key Resistance Breakout
Key Insights
Pepe’s price rises for three days as improving sentiment boosts retail demand, supported by stronger participation and steady gains in futures open interest.
Futures open interest climbs above $213 million, signaling growing trader confidence as rising positions align with
CryptoNewsLand4h ago
BNB Price Steady Above $633 as Bulls Face Strong Barriers
Key Insights:
BNB holds above the 50-day EMA near $633, supported by whale activity, while mixed derivatives data keep price action within a consolidation range.
Technical indicators, including RSI and MACD, show mild bullish momentum, though strong resistance levels near $662 and $680
CryptoNewsLand4h ago
Solana Eyes $87 Breakout as Bullish Signals Strengthen
Solana sits near key resistance around $87 as on-chain activity and positive funding buoy bullish momentum; whale-led demand in derivatives supports a potential breakout. RSI >50 and positive MACD indicate rising upside, with a path toward $92–$97 and support near $77.
CryptoNewsLand5h ago