
Key Takeaways
-
SAND price is showing early signs of stabilization after recent downside pressure.
-
Buyers appear to be defending a key support zone, hinting at a potential short-term rebound.
-
A breakout above nearby resistance could open the door for a stronger recovery move.
Gaming-focused crypto tokens are back in the spotlight after Axie Infinity (AXS) posted a sharp rally of over 16% in a single day and more than 246% over the past month, reigniting optimism around the gaming narrative. Riding this renewed momentum, Sandbox (SAND) has also stepped into focus, climbing nearly 45% as overall market sentiment turns constructive.
Beyond the recent price bounce, the technical structure on the chart is starting to tell a bigger story, hinting that SAND may be setting up for a bullish continuation move.
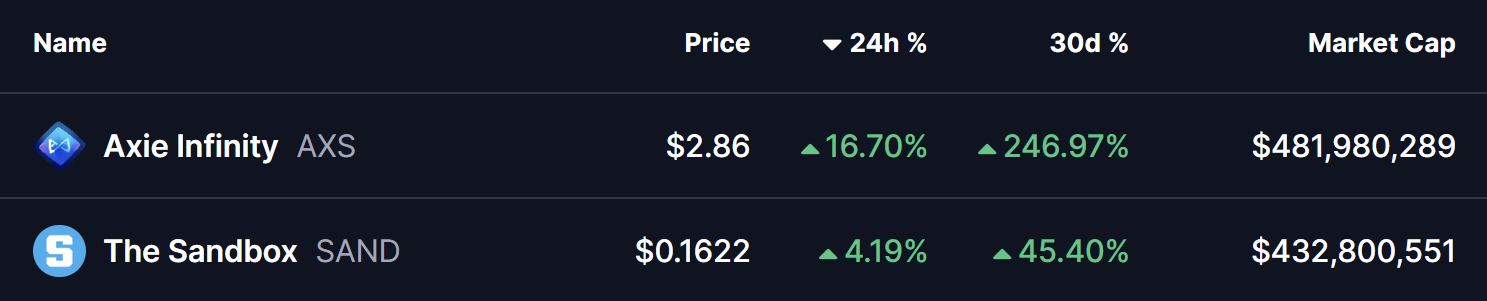
Source: Coinmarketcap
Descending Broadening Wedge Pattern in Play
On the daily timeframe, SAND is trading within a descending broadening wedge — a bullish reversal pattern that often develops during corrective phases before a trend shift. This structure reflects increasing volatility, with price gradually compressing while buyers quietly regain control.
During the latest pullback, SAND successfully retested the lower boundary of the wedge near the $0.11 zone, an area that has repeatedly acted as strong demand. Buyers stepped in aggressively at this level, triggering a rebound that pushed price toward $0.1711, placing SAND right near the wedge’s upper resistance trendline.
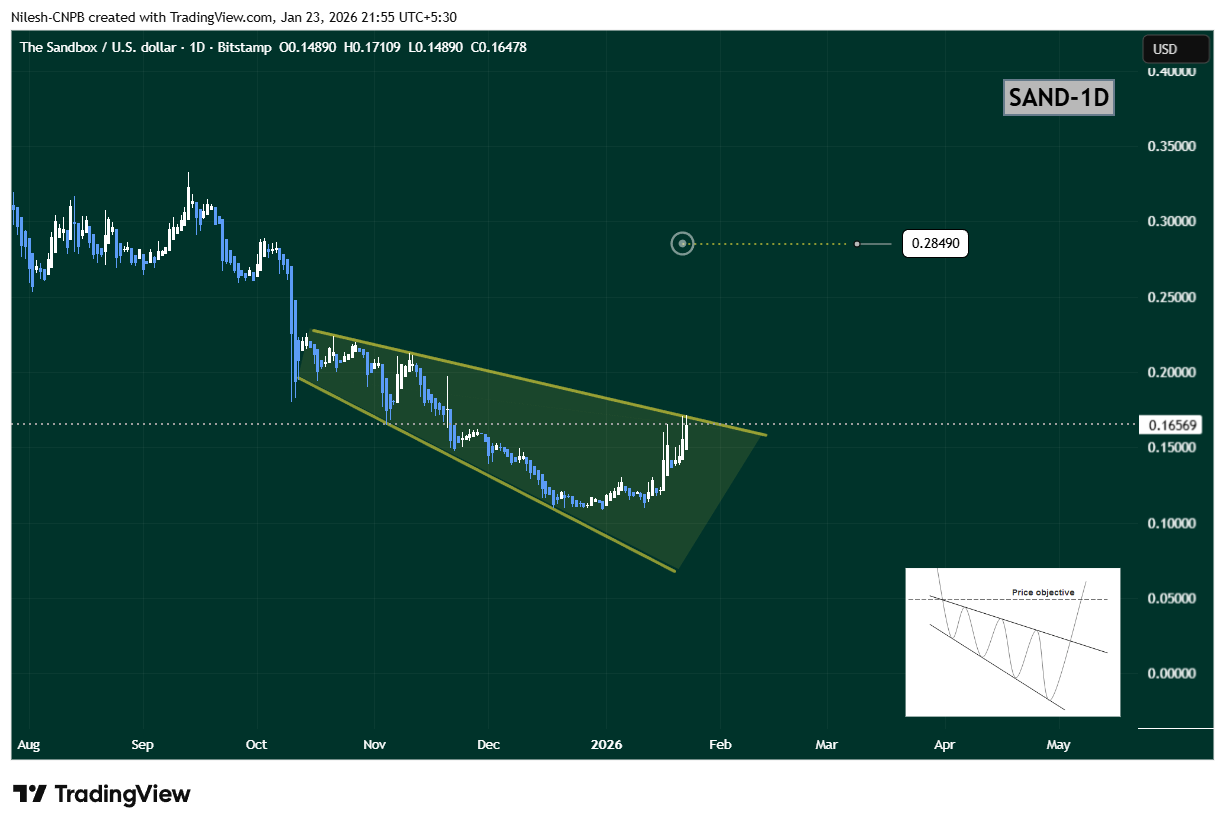
Sandbox (SAND) Daily Chart/Coinsprobe (Source: Tradingview)
The steady rise toward this upper boundary suggests growing bullish momentum and increasing breakout pressure.
What’s Next for SAND?
If buyers manage to push SAND above the upper wedge resistance near $0.1711, it would confirm a bullish breakout from the pattern. In that scenario, the chart opens the door for a move toward the $0.2849 target, which aligns with the measured move of the wedge and represents roughly 73% upside from current levels.
However, if price faces rejection at resistance, SAND could continue consolidating within the wedge structure. In that case, the $0.13–$0.14 region will act as an important short-term support zone to watch.
Bottom Line
SAND’s overall technical structure remains constructive. With a bullish descending broadening wedge in play, buyers defending key support, and gaming tokens gaining renewed attention, Sandbox appears to be positioning for a potential breakout. A confirmed move above resistance could mark the beginning of a stronger upside phase in the sessions ahead.
Disclaimer: The views and analysis presented in this article are for informational purposes only and reflect the author’s perspective, not financial advice. Technical patterns and indicators discussed are subject to market volatility and may or may not yield the anticipated results. Investors are advised to exercise caution, conduct independent research, and make decisions aligned with their individual risk tolerance.
About Author: Nilesh Hembade is the Founder and Lead Author of Coinsprobe, with over 5 years of experience in the cryptocurrency and blockchain industry. Since launching Coinsprobe in 2023, he has been providing daily, research-driven insights through in-depth market analysis, on-chain data, and technical research.
Disclaimer: The information on this page may come from third parties and does not represent the views or opinions of Gate. The content displayed on this page is for reference only and does not constitute any financial, investment, or legal advice. Gate does not guarantee the accuracy or completeness of the information and shall not be liable for any losses arising from the use of this information. Virtual asset investments carry high risks and are subject to significant price volatility. You may lose all of your invested principal. Please fully understand the relevant risks and make prudent decisions based on your own financial situation and risk tolerance. For details, please refer to
Disclaimer.
Related Articles
Is Bitcoin mispricing a prolonged Iran war? Ex-hedge fund manager weighs in
James Lavish warns Bitcoin holders that continued conflict in Iran could trigger inflation and market downturns. While Bitcoin may face further declines, he sees potential long-term opportunities. He discusses the impact of global economic pressures on investments.
Cointelegraph11m ago
10x Research: Tether’s USDT issuance on Ethereum surpasses Tron—ETH could become the main beneficiary of stablecoin growth
10x Research noted that over the past five years, Ethereum (ETH) has performed lackluster, with its price trading around $2,000, mainly due to weak on-chain activity leading to insufficient demand. After falling 57% from its 2025 peak, ETH’s current valuation remains low, while capital accumulation is still ongoing; USDT’s issuance has surpassed Tron, sparking discussion that ETH could become a leading beneficiary of stablecoin growth. Analysts are now re-evaluating ETH’s potential turning point.
GateNews26m ago
Bitcoin Holds Steady Near $67K Amid Bullish and Geopolitical Tension
This weekend, Bitcoin ($BTC) has shown a steady performance in line with a blend of technical and geopolitical outlook. In this respect, Bitcoin ($BTC) is changing hands at $67K with significant support levels at $64K and $65K and notable resistance at $74K. As per the data from CRYPTO Damus, the
BlockChainReporter39m ago
XRP Trading Volume Drops by 50% as the Altcoin Records Six Consecutive Red Monthly Closes
XRP trading volume drops by 50%, feeding bearish expectations.
The altcoin records six consecutive red monthly closes.
Could this be the longest coil for XRP before the biggest launch?
The crypto community is disheartened to see the
CryptoNewsLand3h ago
VanEck Research Head: BTC derivatives protection demand hits the 99th percentile, releasing a contrarian long setup signal
VanEck research chief Matthew Sigel noted that protective demand in the Bitcoin derivatives market has reached a historical high, suggesting the market may be suitable for establishing long positions. At the same time, he warned that high spending in the AI sector without returns could put pressure on the market.
GateNews3h ago
Bitcoin’s ‘no direction’ action may lead to heavier breakout: Analyst
Bitcoin's prolonged consolidation below $70,000 may indicate a potential rally, despite mixed analyst sentiment. While some predict a breakout, others warn of deeper bearish trends. Current trading is stagnant, with Bitcoin at $66,890.
Cointelegraph4h ago
