- Bitcoin whales accumulated 104,340 BTC while million-dollar transfers reached two-month highs recently.
- Analysis shows no clear capital rotation from gold to Bitcoin despite popular belief among investors.
- Bitcoin consolidates near $88,680 with key resistance at $95,000 and critical support around $85,000.
Large Bitcoin holders are on the move. Wallets containing at least 1,000 BTC have accumulated 104,340 additional coins recently. This represents a 1.5% increase in holdings among these major players.
Santiment reported the accumulation trend on X (formerly Twitter). The analytics platform also noted that daily transfers exceeding $1 million have climbed back to two-month highs. These metrics suggest renewed activity among institutional and high-net-worth investors.
🐳 Large Bitcoin whales are accumulating at an encouraging pace, wallets with at least 1K $BTC have collectively accumulated 104,340 more coins (a +1.5% rise). Additionally, the amount of $1M+ daily transfers is back up to 2-month high levels.
🔗 Chart: https://t.co/CJOfiOBbWU pic.twitter.com/4loxDFtUdb
— Santiment (@santimentfeed) January 25, 2026
Bitcoin Whales Drive Accumulation Trend
The accumulation pattern comes as Bitcoin trades near $88,680. Large holders appear undeterred by recent price volatility. Their buying activity contrasts with the broader market’s hesitant sentiment.
Transaction data supports the whale accumulation narrative. The surge in million-dollar transfers indicates substantial capital movement. This level of activity hasn’t been seen in two months.
Market observers view whale behavior as a potential leading indicator. When major holders accumulate, smaller investors often take notice. However, past patterns don’t guarantee future outcomes.
Gold-Bitcoin Rotation Remains Unproven
Analysis by Darkfost challenges the popular capital rotation thesis. Many investors expected money to flow from gold into Bitcoin. The data tells a different story.
Throughout this cycle, many have talked about a rotation of capital from gold into Bitcoin.
Well, those people are still waiting…
📊 This chart illustrates periods where BTC outperforms or underperforms depending on gold’s trend.
It provides two signals :
🟢 Positive = BTC >… pic.twitter.com/nKWKUry9F7
— Darkfost (@Darkfost_Coc) January 24, 2026
A comparative chart tracks both assets against their 180-day moving averages. The analysis reveals nearly equal periods of Bitcoin outperformance and underperformance. Green signals appeared slightly more often than negative ones.
This balanced distribution undermines rotation claims. Bitcoin continues developing its own path, the analyst noted. Even positive signals don’t confirm capital leaving gold for crypto.
The independence between these assets persists. Correlation doesn’t equal causation in this relationship. Investors hoping for a clear rotation pattern may be disappointed.
Bitcoin Price Action Shows Consolidation
Bitcoin rejected the mid-$90,000 zone after testing resistance. The cryptocurrency now trades in a broad sideways range. Lower highs have formed since November’s peak near $115,000.
Key resistance sits between $90,500 and $92,000. Above that, the $95,000 to $98,000 zone represents major supply. Breaking $100,000 would invalidate the current bearish structure.
Support levels anchor the range below current prices. The $88,000 to $87,500 zone provides immediate backing. Critical support exists at $85,000, with deeper levels at $80,000 to $82,000.
Technical indicators show weakening momentum. The RSI sits at 41, below the neutral 50 mark. The MACD turned bearish with red histogram bars appearing.
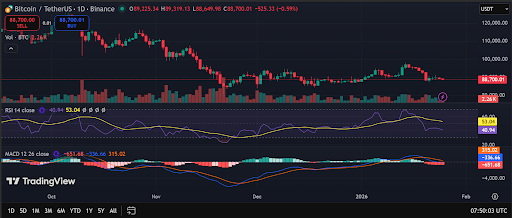
The Bitcoin daily price chart shows sideways movement. Source: TradingView
Market Outlook and Key Levels to Watch
Volume has declined during recent bounce attempts. This suggests weak conviction among buyers. Compressed price action typically precedes significant moves.
Three scenarios emerge from current conditions. Continued range trading between $85,000 and $95,000 appears most likely. Momentum remains subdued while markets await catalysts.
A bearish breakdown becomes possible below $85,000. That could push prices toward $82,000 or even $80,000. Confirmation would require RSI falling under 35.
The bullish case needs a clean break above $92,000. Reclaiming $95,000 would shift the outlook. Targets would extend toward $100,000 and potentially $105,000.
Bitcoin sits at a critical juncture. Whale accumulation provides one bullish signal. However, technical indicators suggest caution remains warranted. The coming weeks should reveal which force prevails.
Disclaimer: The information on this page may come from third parties and does not represent the views or opinions of Gate. The content displayed on this page is for reference only and does not constitute any financial, investment, or legal advice. Gate does not guarantee the accuracy or completeness of the information and shall not be liable for any losses arising from the use of this information. Virtual asset investments carry high risks and are subject to significant price volatility. You may lose all of your invested principal. Please fully understand the relevant risks and make prudent decisions based on your own financial situation and risk tolerance. For details, please refer to
Disclaimer.
Related Articles
BTC 15-minute rise of 0.53%: Institutional derivatives adding positions drives a short-term rebound
Between 2026-04-20 01:30 and 2026-04-20 01:45 (UTC), the BTC spot price fluctuated within a narrow range of 74290.9 to 74709.7 USDT. Over the 15-minute period, the return was +0.53%, with a range of 0.56%. Overall market volatility increased, drawing attention, but the number of active on-chain addresses remained steady, with no sign of extreme capital movements.
The main driver behind this move is institutional capital inflows into mainstream futures platforms and adjustments to derivatives position structures, especially CME futures open interest (OI), which rose against the trend by 2.61%. Meanwhile, some institutions added to defensive hedges and positioned for short-term rebounds within the price consolidation range. In addition, short-term Put options trading on platforms such as Deribit was active: the main contracts were concentrated on near-term downside protection, indicating that derivatives capital has increased its allocation to defensive strategies and that the spot market has passively followed the upward move.
In addition, ETF funds recorded $1.87 billion in net inflows in Q1, easing the consecutive net outflow trend seen earlier before March and providing medium-term background support for spot prices. Although on-chain active addresses over 1 hour stayed in the 19500–19600 range without abnormal increases or decreases, structural behavior by institutions across the derivatives and ETF markets converged to push short-term price volatility higher. There were no signals of sell pressure from retail traders or major whales, and no large transfers or extreme liquidation events; overall momentum came from institutional-level maneuvering.
It is worth noting that the derivatives market Put/Call ratio remains on the high side. If the price cannot continue moving upward, short-term exit pressure could intensify at any time. With overall OI shrinking, the activity of leveraged funds in the market weakens. Going forward, it is important to focus on changes in derivatives positions, ETF fund flows, and the in-and-out movements of active capital on-chain in order to respond to the risk of sharp short-term volatility. For more market information, it is recommended to continuously track relevant data indicators and capital-level anomalies.
GateNews3h ago
BTC falls 0.44% in 15 minutes: ETF fund outflows and derivatives shorts add to the slide
From 21:45 to 22:00 (UTC) on April 19, 2026, the BTC price dropped by 0.44% within 15 minutes. The candlestick range was 74,366.1 to 74,789.3 USDT, with an amplitude of 0.57%. Short-term volatility was concentrated. During this period, the trading volume for large orders rose significantly, market attention increased, and volatility intensified.
The main driving force behind this deviation was that U.S. spot Bitcoin ETFs saw a large net outflow of $291 million over two days from April 18 to April 19. This reflected institutional funds pulling away in the short term, which led to a marked increase in sell pressure in the spot market. At the same time, BTC perpetual contract
GateNews6h ago
BTC falls below 74000 USDT
Gate News bot message, Gate market data shows that BTC has fallen below 74000 USDT, with a current price of 73979.6 USDT.
CryptoRadar6h ago
BTC dips slightly by 0.53% in 15 minutes: whale transfers increase sell pressure and amplified liquidity widen the short-term drop
From 17:45 to 18:00 (UTC) on 2026-04-19, within 15 minutes BTC’s spot price fell -0.53%, with a price range of 74648.4 to 75212.8 USDT and a swing of 0.75%. During this period, market attention increased, volatility clearly accelerated, and the magnitude of the abnormal move exceeded typical levels for the same timeframe.
The main driver behind this abnormal move was that large-whale accounts concentrated transfers of BTC to a certain major exchange; the All Exchanges Whale Ratio (EMA14) rose to a near-ten-month high, and sell pressure increased significantly in a short time, becoming a direct cause of the spot price decline.
GateNews10h ago
BTC falls below 75,000 USDT
Gate News bot message, Gate quotes show that BTC has fallen below 75,000 USDT, with a current price of 74,985.2 USDT.
CryptoRadar11h ago
