After weeks of dull trading, the Zcash (ZEC) price has just experienced an important development. Since January 19th, ZEC has increased by nearly 15%, recovering from a bottom $336 up to around $362. Notably, this rally occurred just a few days after a bearish pattern was confirmed, which is often a trap for short sellers.
On the surface, the price structure still carries significant risks. However, internally, accumulation activity is quietly gaining momentum. Currently, the market focus is on an important price level: Zcash is about 9% away from a key Fibonacci level and is also approaching the 100-day EMA. Whether the price can break through this zone will determine if this recovery is just a technical bounce or the start of a new bullish trend.
100-Day EMA: The Challenge Zone for the Recovery Trend
Zcash’s recovery is not accidental. After the head-and-shoulders pattern was broken, the price quickly fell to $336 before buying pressure emerged, creating a “bear trap” for sellers.
From there, ZEC’s price increased by about 15%, stopping just below the 100-day EMA — an important trend indicator reflecting recent price strength. History demonstrates the influence of the 100-day EMA: the last time Zcash reclaimed this level (on December 3rd), the price surged over 70% in the following weeks. While past performance does not guarantee future results, this is a price zone that the market pays close attention to.
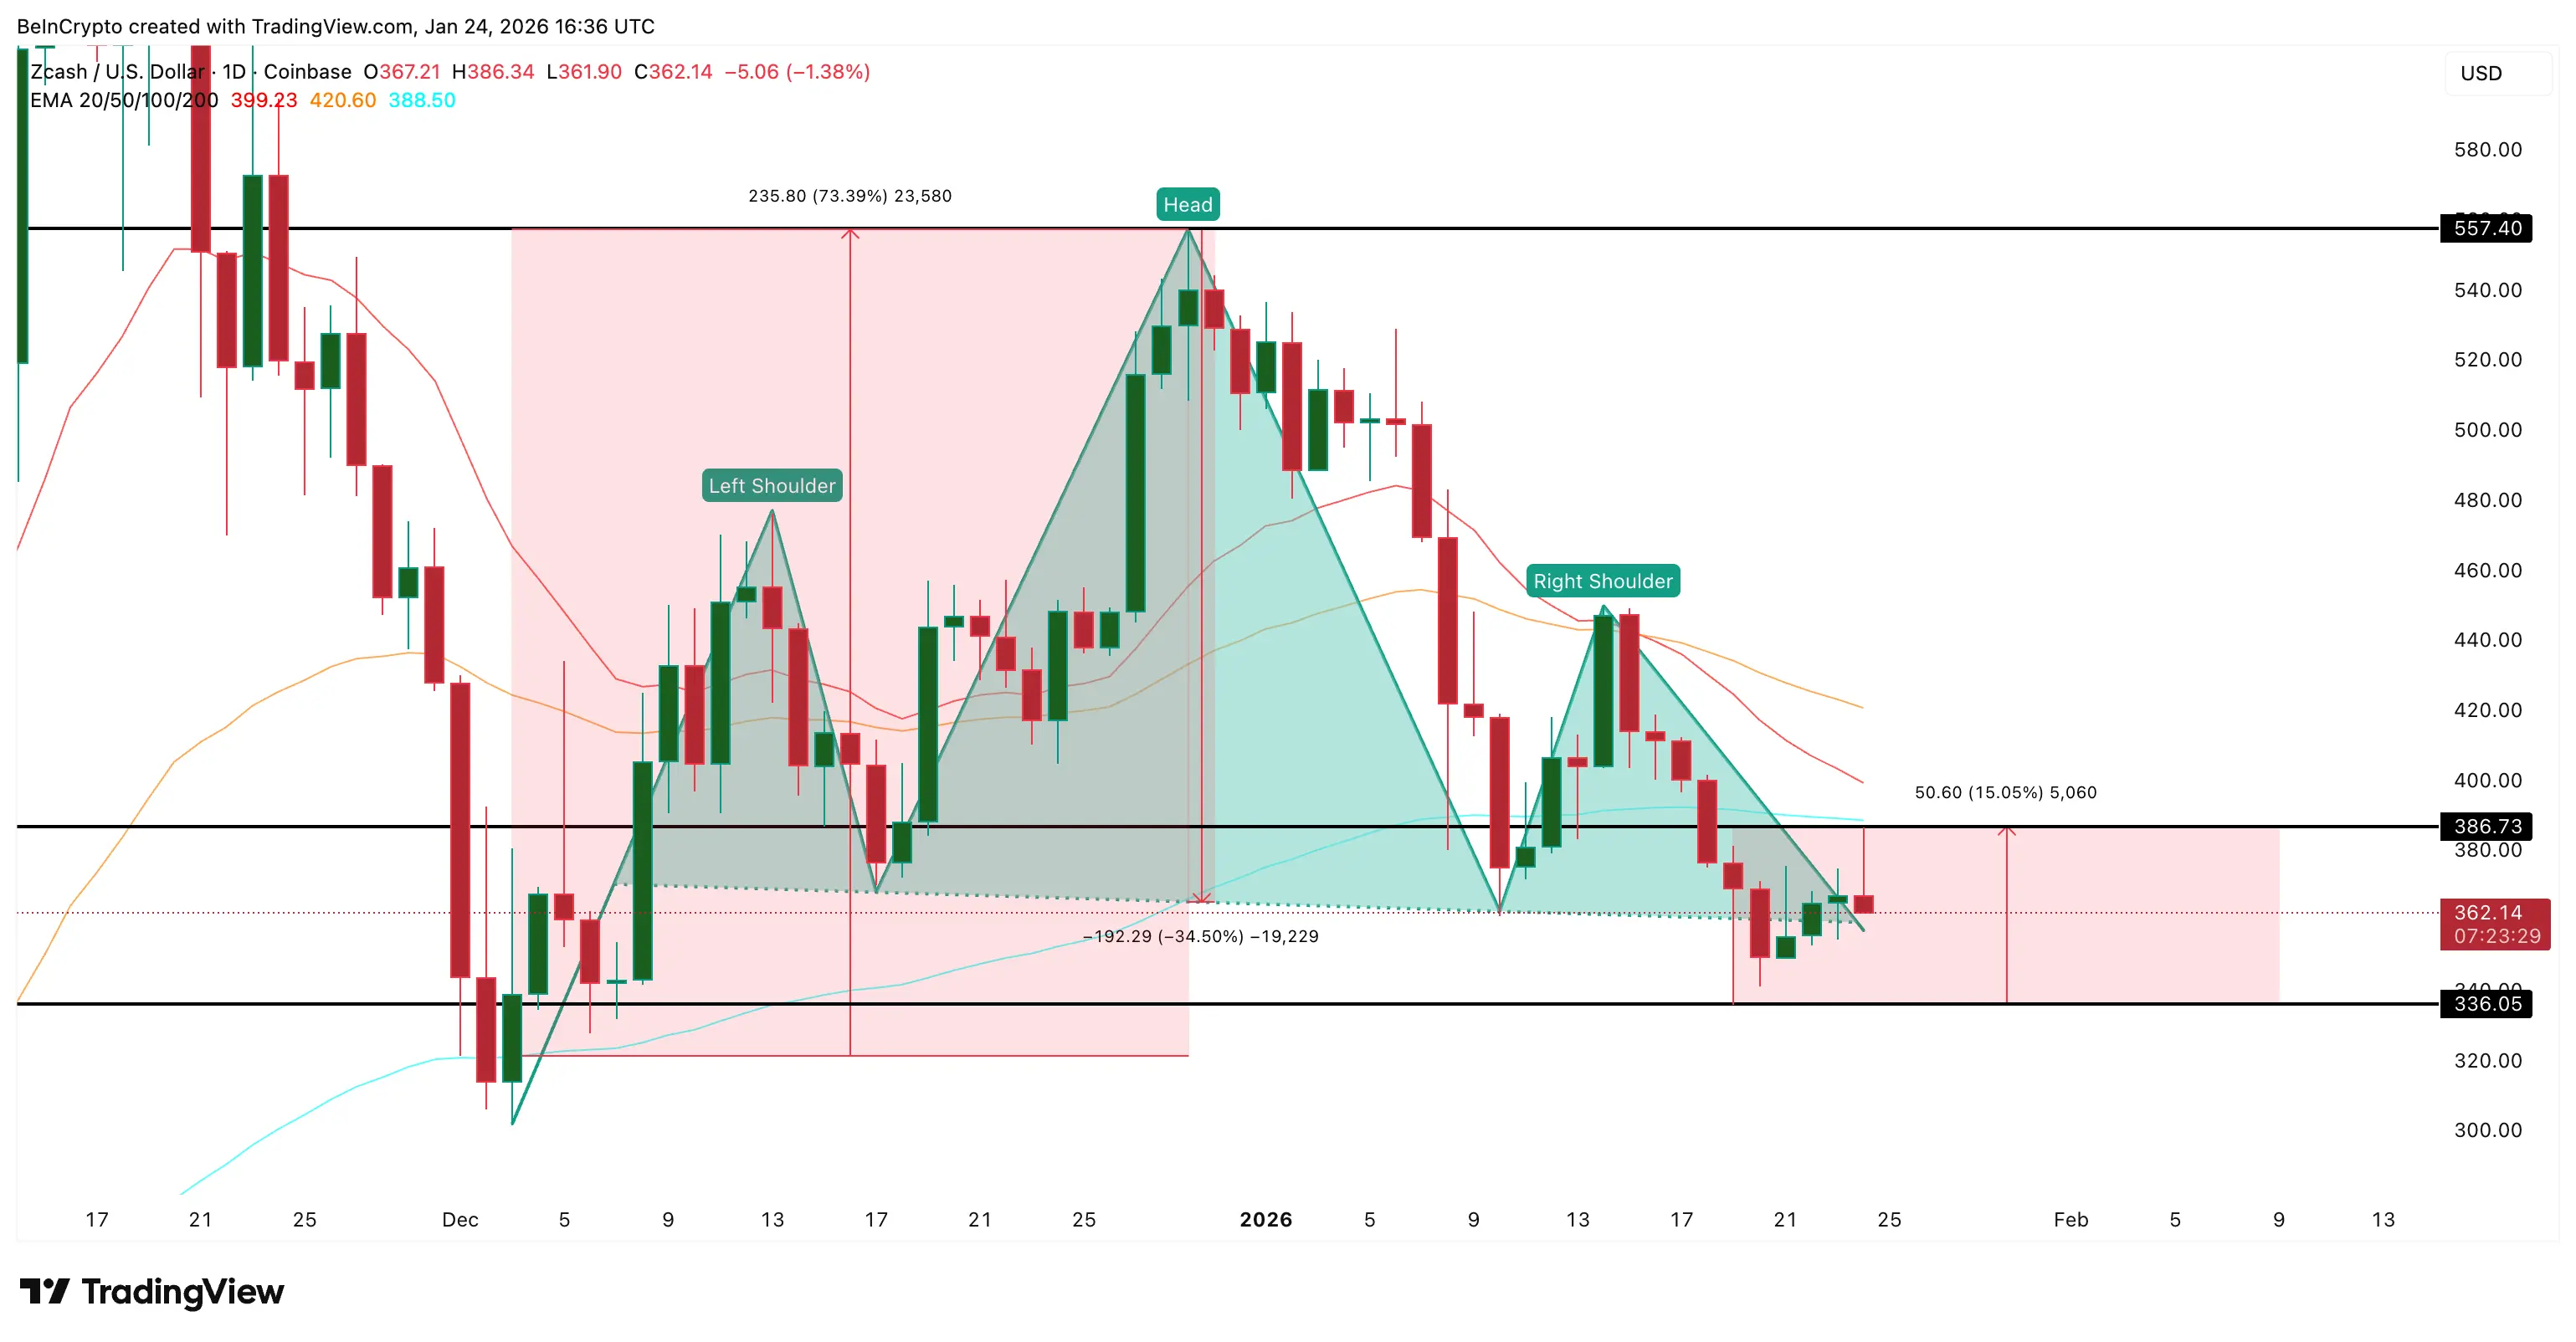 Zcash Trap Setup | Source: TradingViewMeanwhile, selling pressure has not disappeared — ZEC continues to struggle approaching the $386 zone, indicating that supply remains strong. The technical bearish structure still exists, and the question is whether current buying activity is enough to break this barrier.
Who is Buying During the Price Dip? Whales Are Accumulating Strongly
On-chain data shows notable accumulation from “big whales” — the top 100 addresses holding the most ZEC increased their holdings by 9% over the past week, bringing their total to 42,623 ZEC, equivalent to a net purchase of nearly 3,500 ZEC during the recovery phase.
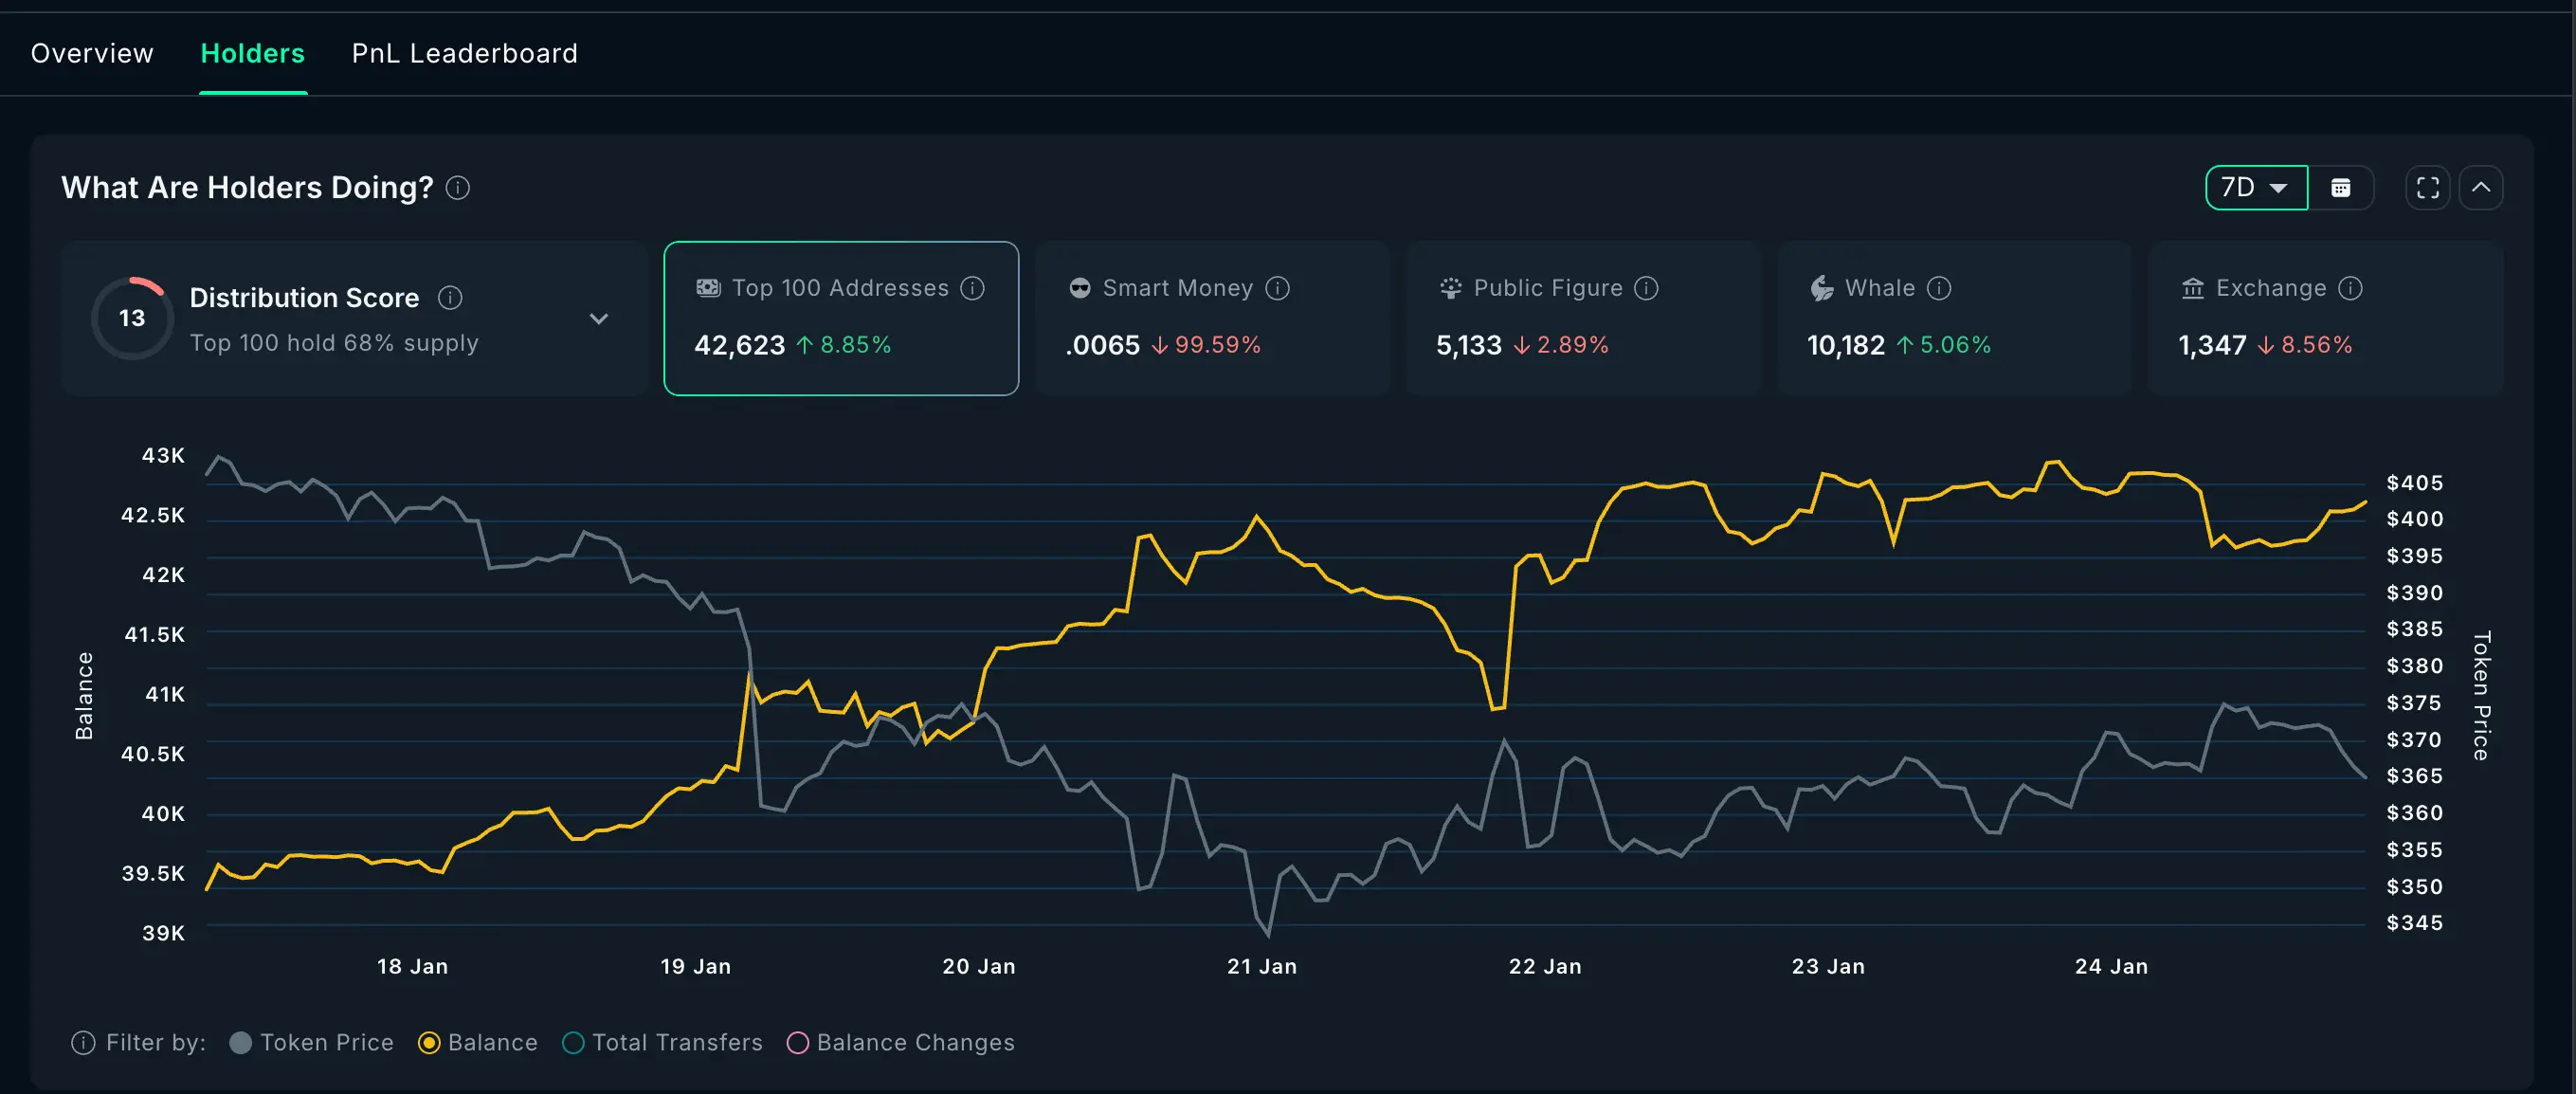 Accumulation of ZEC Continues | Source: NansenThe usual whale groups are also active, increasing holdings by 5% (10,182 ZEC), roughly 480 ZEC more. Overall, whales have bought about 4,000 ZEC since January 19th. This accumulation follows the bearish pattern confirmation, reflecting expectations for a price rebound. However, smart money is withdrawing from the market, indicating that most large investors remain cautious about strong short-term growth potential.
Momentum indicators also support this view: from January 14th to 24th, ZEC’s price declined but the Money Flow Index (MFI) increased, creating a bullish divergence — a sign that buying interest at the lows is emerging, helping to limit further downside risk.
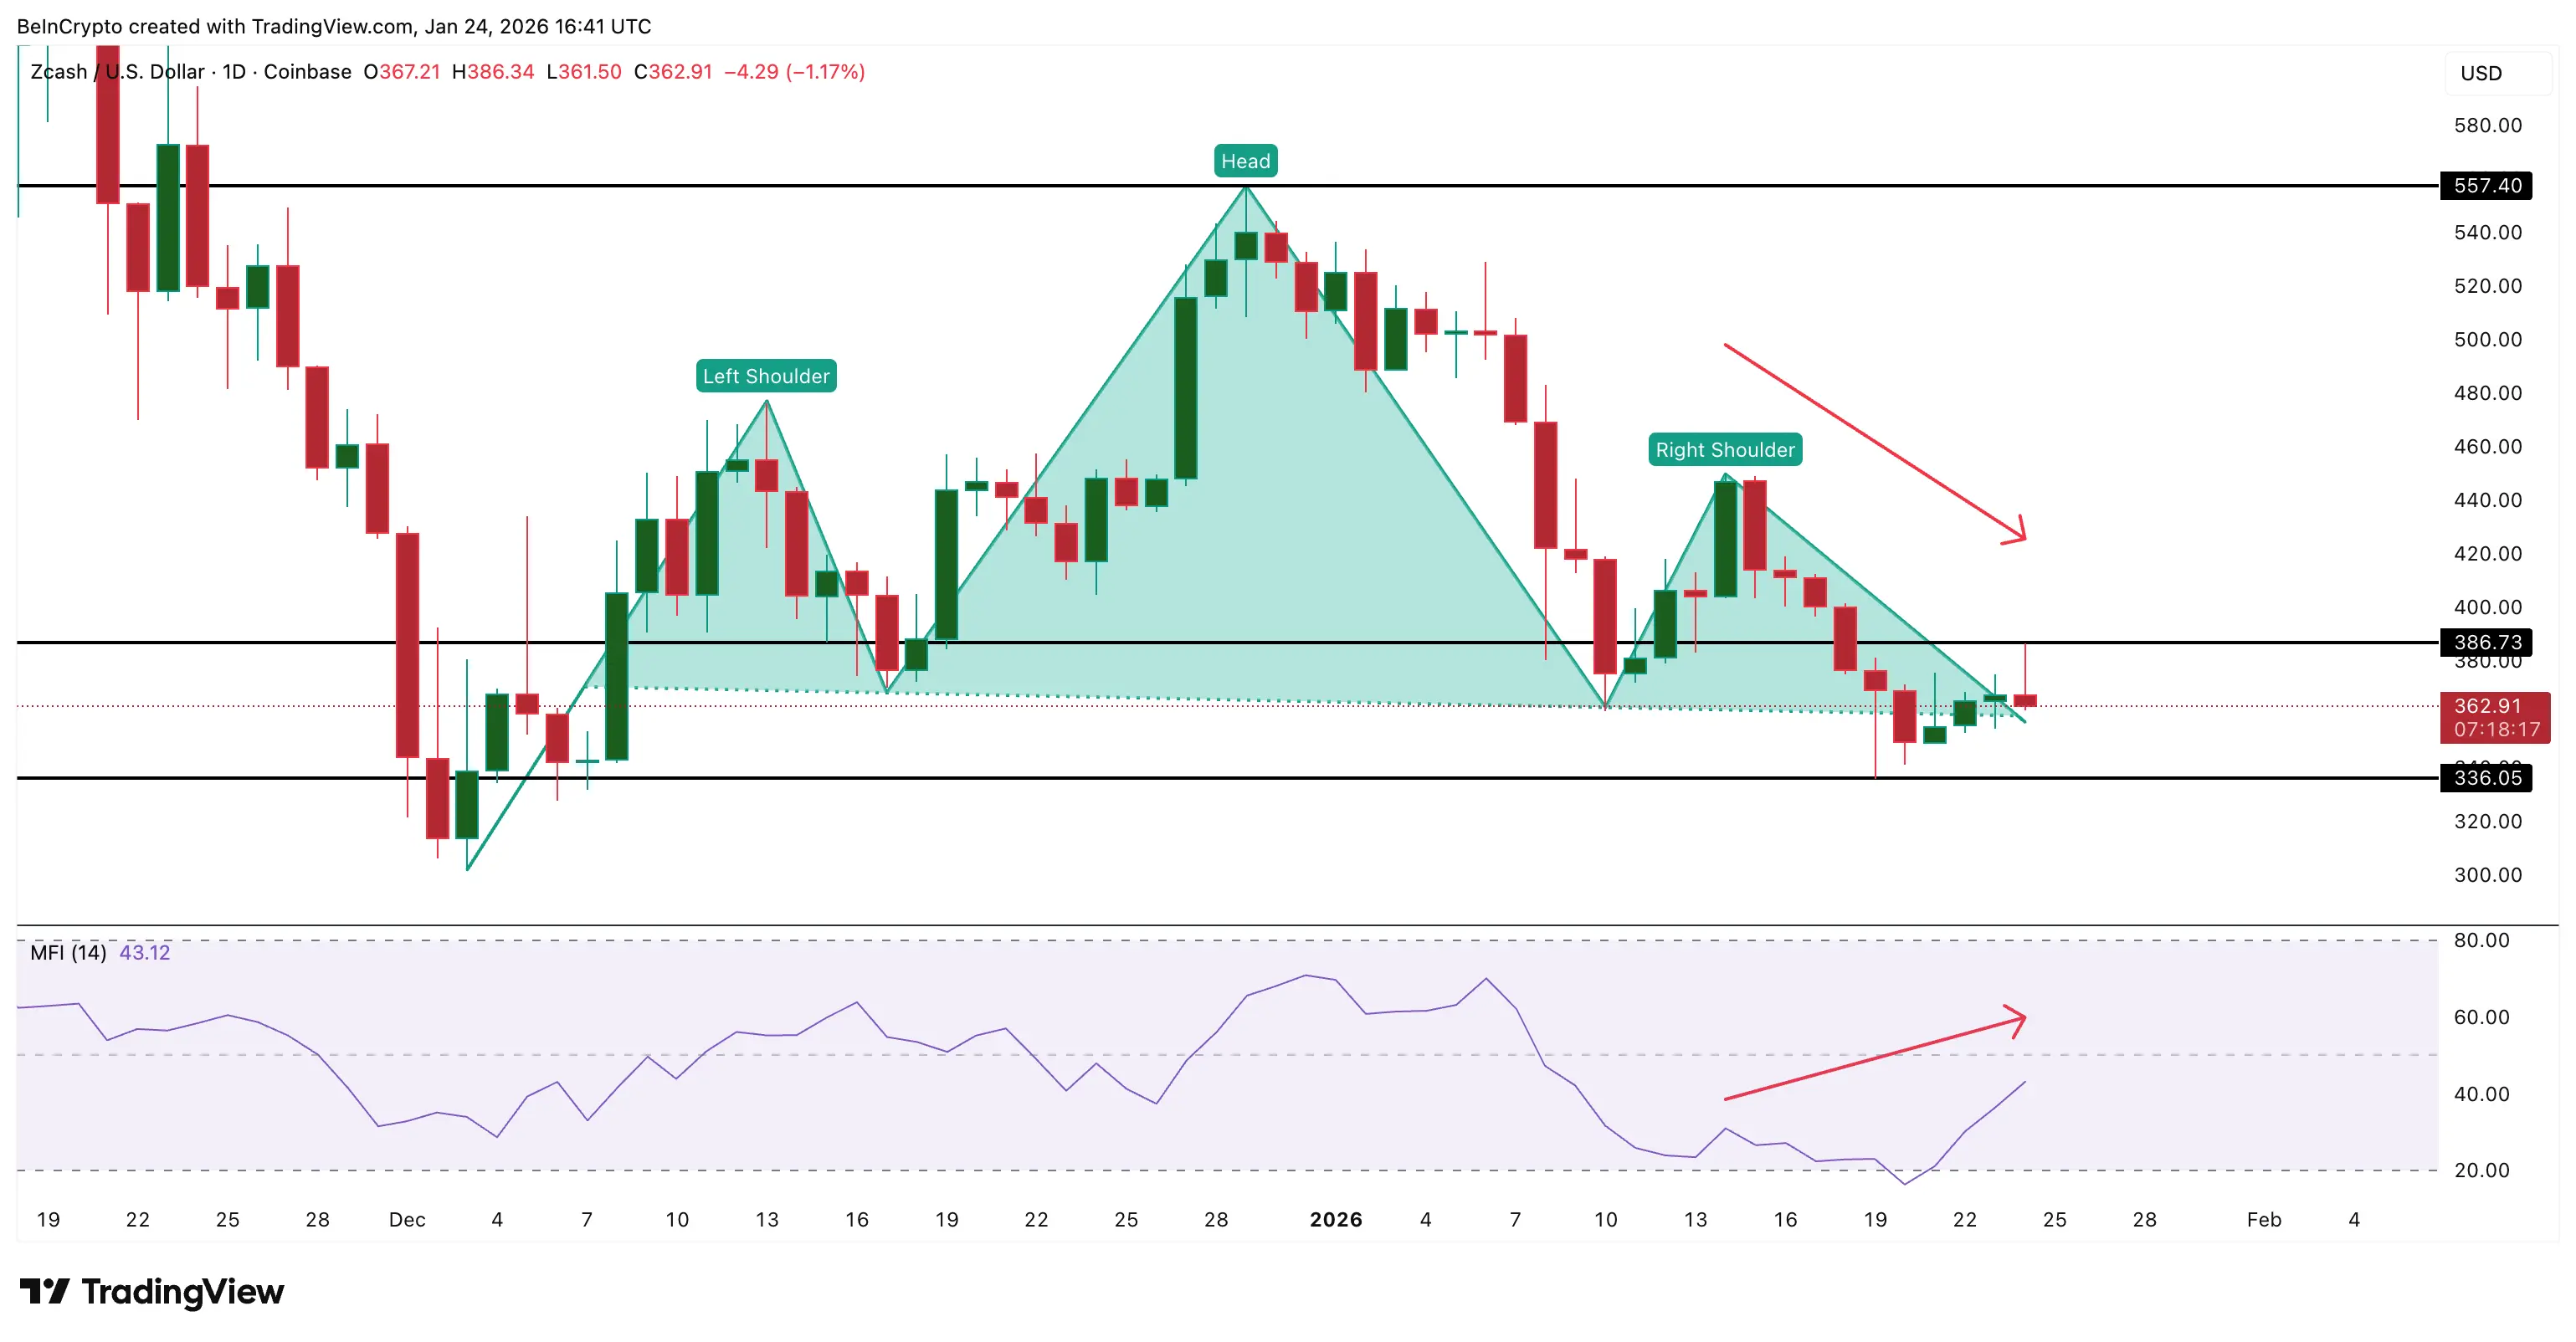 Strong Buying Activity | Source: TradingViewIn the derivatives market, after recent volatility, leverage ratios have stabilized. On Binance’s ZEC perpetual contract, the liquidation value of short positions ($26.37 million) remains higher than long positions ($22 million), indicating that a modest upward move could trigger short position liquidations, pushing the price higher.
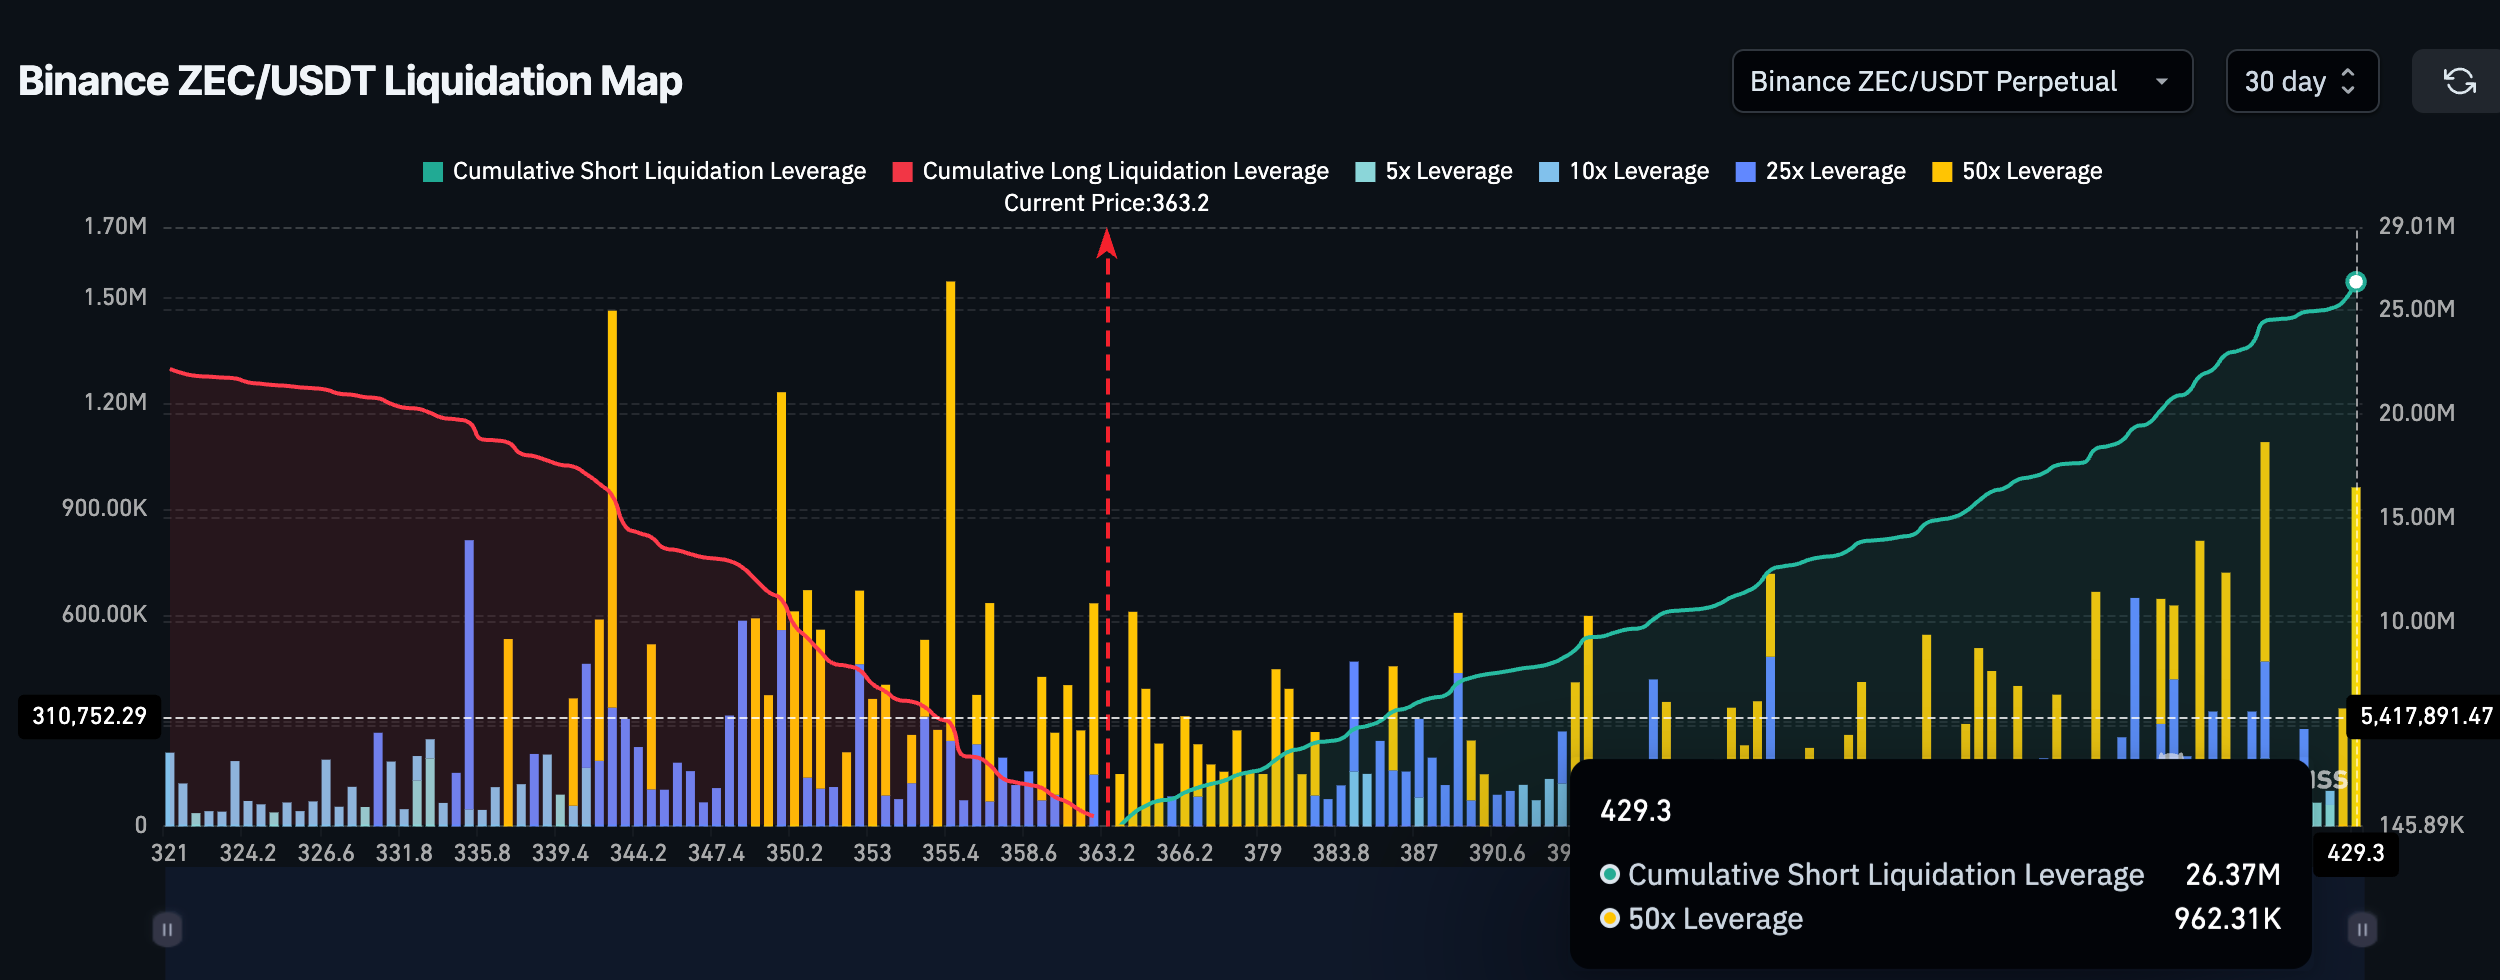 More Shorts Than Longs | CoinglassOverall, all data points indicate that accumulation is clearly underway.
Key Price Zones: Opportunities and Risks for the Next Trend
The current price structure is quite clear:
Until one of these zones is broken, Zcash remains within a narrow “decision zone” of the market.
Conclusion: ZEC has recovered 15%, whales are accumulating during a weak phase, and buying interest at the lows has become evident. Currently, the price is only about 9% away from a zone that historically could trigger a strong upward trend. This is a critical moment to determine Zcash’s next move.
Disclaimer: The information on this page may come from third parties and does not represent the views or opinions of Gate. The content displayed on this page is for reference only and does not constitute any financial, investment, or legal advice. Gate does not guarantee the accuracy or completeness of the information and shall not be liable for any losses arising from the use of this information. Virtual asset investments carry high risks and are subject to significant price volatility. You may lose all of your invested principal. Please fully understand the relevant risks and make prudent decisions based on your own financial situation and risk tolerance. For details, please refer to
Disclaimer.
Related Articles
Dogecoin Holds $0.094 as X Cashtags Drive Market Attention
Key Insights
Dogecoin holds above $0.094 despite market weakness as Bitcoin and Ethereum stabilize, reflecting resilience and sustained demand across major cryptocurrencies during the consolidation phase.
X launches smart cashtags enabling real-time crypto and stock tracking, improving marke
CryptoNewsLand15m ago
Dogecoin Holds $0.09 Support as $0.10 Breakout Looms
Dogecoin remains around $0.09, showing limited movement as traders await a clear breakout direction. Key support is at $0.08, with resistance at $0.10. Current technical indicators suggest a balanced market, but a decisive move is needed to shift momentum.
CryptoNewsLand1h ago
XRP Price Clears $1.40 While Broader Downtrend Persists
XRP's recent rise above $1.40 indicates a shift in market behavior after a consolidation phase. While momentum indicators show improvement, the broader bearish trend persists, limiting upside potential. Sustained support is crucial for extending its recovery.
CryptoNewsLand1h ago
Chainlink Price Compresses Below $10 as Breakout Pressure Builds
Key Insights
Chainlink maintains higher lows within a tightening range, reflecting steady accumulation as buyers absorb selling pressure and prepare for a potential breakout move
Repeated resistance tests near $10 weaken supply levels while rising support strengthens demand, increasing the p
CryptoNewsLand1h ago
XRP Consolidation Signals Reset as Bullish Setup Emerges
XRP has recently rebounded to $1.39 after trading between $1.20 and $1.40 due to improved market sentiment. A significant drop in futures open interest reflects reduced speculation, while technical indicators suggest a potential bullish breakout, targeting $1.50 and possibly $1.80.
CryptoNewsLand2h ago
Shiba Inu Sees 82.5B Token Outflow as Market Structure Shifts
Key Insights
Shiba Inu saw 82.5 billion tokens exit exchanges within 24 hours, signaling reduced supply pressure and increasing accumulation behavior among larger holders.
Exchange net flows remain positive as inflows persist, yet rising outflows suggest a gradual balance forming between
CryptoNewsLand2h ago
