
Key Takeaways
-
Hyperliquid (HYPE) has dropped over 19% on the week, with price stabilizing near a critical demand zone.
-
The $19.22–$19.55 support area is emerging as a key level where sellers may lose control.
-
A bearish Shark harmonic pattern is forming on the daily chart, hinting at a potential rebound if support holds.
-
Strong token burns and notable whale buying are acting as a contrarian signal amid broader weakness.
-
A reclaim of the 50-day moving average near $26.39 could confirm a bullish recovery phase.
Hyperliquid’s native token, HYPE, remains under sustained selling pressure as bearish momentum continues to dominate short-term price action. As of January 21, HYPE is trading nearly 9% lower on the day, extending its weekly decline to over 19%. The token is currently hovering around the $20.65 region, an area that is quickly becoming a decisive technical battleground.
While the chart reflects heavy downside pressure, a mix of aggressive supply reduction, strategic buying, and an emerging harmonic structure is raising the question: Is a rebound quietly setting up beneath the surface?
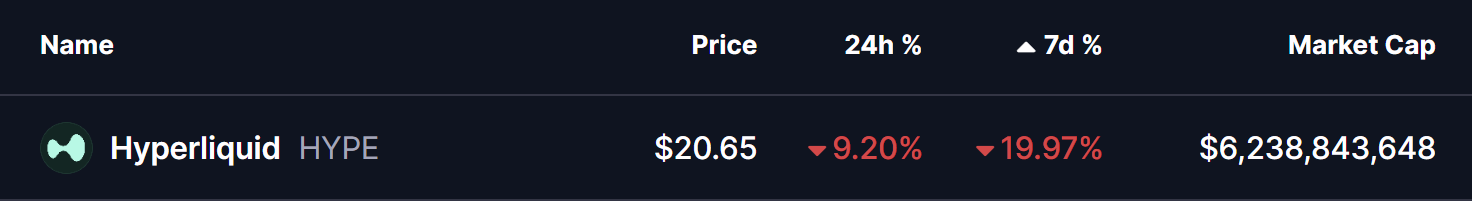
Source: Coinmarketcap
Burn and Buying Add a Contrarian Signal
Despite the ongoing price weakness, on-chain activity tells a more nuanced story.
As of January 21, Hyperliquid’s assistance fund burned 39 million HYPE tokens, permanently removing roughly 3.9% of the maximum supply from circulation. At the same time, notable buyers stepped in during the sell-off.
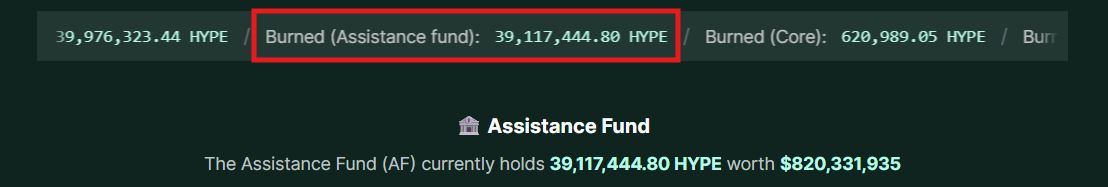
Source: hypeburn
-
Arthur Hayes reportedly purchased** 19,000 HYPE**
-
The assistance fund itself continues to buy aggressively, paying prices over 50% higher than current market levels
This combination of sustained burning and dip-buying suggests growing long-term conviction, even as short-term sentiment remains fragile.
Could This Emerging Pattern Trigger a Rebound?
From a technical perspective, the daily chart shows HYPE entering the early stages of a bearish Shark harmonic pattern.
After completing the O-X-A leg, price rolled over and is now pressing toward the projected B-point support zone between $19.22 and $19.55. This area is highlighted on the chart as a historically reactive demand zone and could mark a potential exhaustion point for sellers.
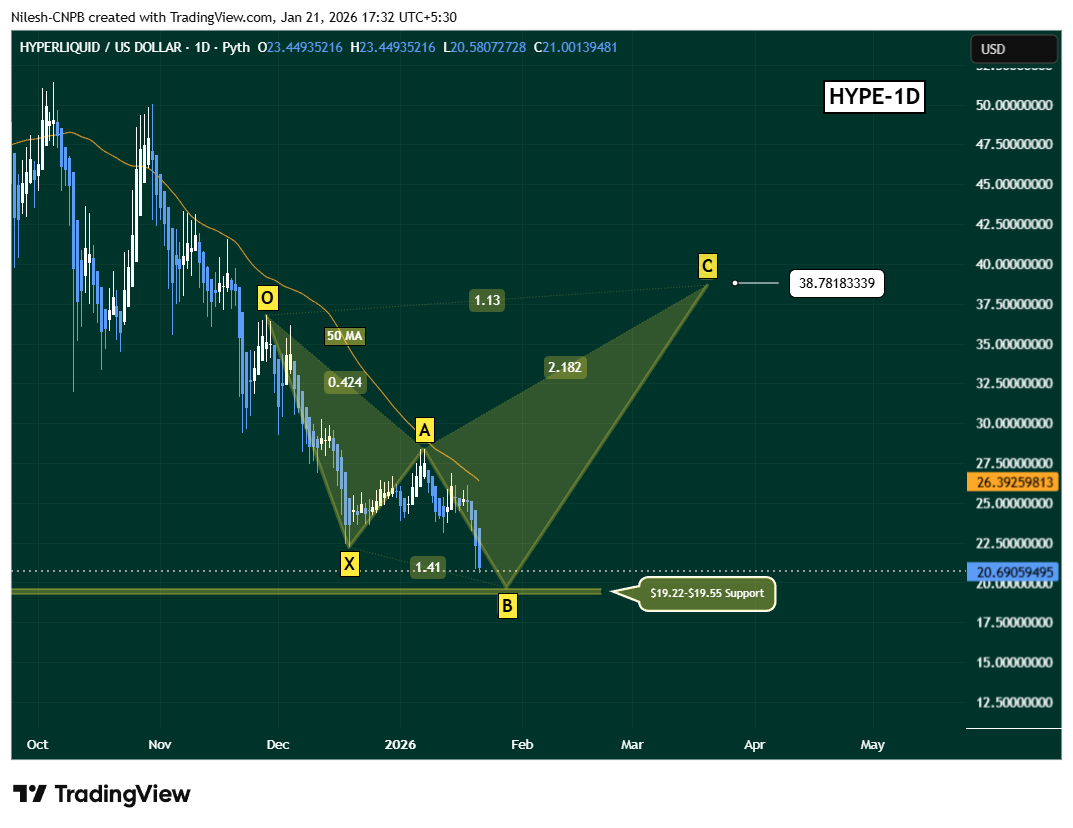
Hyperliquid (HYPE) Daily Chart/Coinsprobe (Source: Tradingview)
If buyers step in around this support and price begins to stabilize, the next key technical hurdle would be a reclaim of the 50-day moving average near $26.39. A decisive move back above this level would strengthen the rebound thesis and open the door for a recovery move toward the C-point near $38.7, where the Shark pattern’s projected extension sits around the 1.13 level.
What’s Next for HYPE?
For now, the pattern remains in development, not confirmed. The coming sessions will be critical.
-
Holding the $19.22–$19.55 zone would keep the harmonic setup alive
-
Rising volume and stronger daily closes could signal buyer commitment
-
A break back above the 50-day MA would act as early confirmation of a trend shift
On the downside, a failure to hold the lower support zone would invalidate the pattern and leave HYPE vulnerable to deeper consolidation.
For now, Hyperliquid sits at a technical inflection point, where intense selling pressure collides with supply destruction and early structural support. Whether this develops into a meaningful rebound or another leg lower will depend on how price reacts at the lower boundary in the days ahead.
Disclaimer: The views and analysis presented in this article are for informational purposes only and reflect the author’s perspective, not financial advice. Technical patterns and indicators discussed are subject to market volatility and may or may not yield the anticipated results. Investors are advised to exercise caution, conduct independent research, and make decisions aligned with their individual risk tolerance.
About Author: Nilesh Hembade is the Founder and Lead Author of Coinsprobe, with over 5 years of experience in the cryptocurrency and blockchain industry. Since launching Coinsprobe in 2023, he has been providing daily, research-driven insights through in-depth market analysis, on-chain data, and technical research.
Disclaimer: The information on this page may come from third parties and does not represent the views or opinions of Gate. The content displayed on this page is for reference only and does not constitute any financial, investment, or legal advice. Gate does not guarantee the accuracy or completeness of the information and shall not be liable for any losses arising from the use of this information. Virtual asset investments carry high risks and are subject to significant price volatility. You may lose all of your invested principal. Please fully understand the relevant risks and make prudent decisions based on your own financial situation and risk tolerance. For details, please refer to
Disclaimer.
Related Articles
Cardano Tests $0.243 Pivot as Breakout Pressure Builds
Key Insights
Cardano trades near a historically strong pivot level at $0.243 while a descending wedge apex forms, increasing the likelihood of a major breakout soon.
A confirmed breakout requires a daily close above $0.2450 and SAR resistance, which could shift momentum toward $0.537 as the
CryptoNewsLand1m ago
Elon Musk References Fuel Trading Surge in 'Asteroid' Crypto Token
Elon Musk's online activity revived interest in a cryptocurrency token known as "Asteroid crypto," causing increased trading and volatility on decentralized exchanges. Market reactions were driven by social media references, illustrating the token's sensitivity to influencer attention.
GateNews1h ago
BTC rises 0.69% over 15 minutes: spot buy-side strength and sustained whale accumulation on-chain reinforce the move
From 14:30 to 14:45 (UTC) on 2026-04-17, the Bitcoin (BTC) market saw clear signs of abnormal movement. The 15-minute candlestick return reached +0.69%, with the price ranging from 77455.4 to 78044.4 USDT and an amplitude of 0.76%. Short-term fluctuations increased market attention, trading volume expanded in parallel, and liquidity improved further.
The main driver behind this abnormal move was a clear strengthening of spot-market buy-side demand. According to on-chain and statistical data, from 14:00 to 15:00, BTC spot buys had the upper hand. Massive buy orders continued to push the price higher, while whale addresses (≥10,000 BTC holdings) were actively net-buying during this period. The inflow of large on-chain funds directly drove spot prices higher. In addition, CME Bitcoin futures open interest increased by 70%, yet there was no large-scale liquidation or forced selling, indicating that institutional capital was returning in an orderly manner and that futures leverage did not become the dominant source of pressure. The leading force behind this upswing came from the spot market, and any wait-and-see sentiment caused by shrinking ETF flows did not suppress short-term prices.
Meanwhile, on-chain data shows that network activity has continued to rise, and the distribution of holdings is becoming more concentrated. In the short term, the coordinated effect of whales and newly onboarded users amplified price elasticity. Benefiting from an increase in macro risk appetite in mid-April—along with dovish signals from the Bank of Japan coinciding with easing geopolitical tensions—BTC’s attractiveness as a risk asset improved, and investors’ risk appetite strengthened. In addition, although ETF net inflows fell to $4.2 million, there were no large outflows, providing bottom support for spot. Multiple factors converged to drive BTC’s short-term rebound within the 15-minute window.
It is worth noting that the SOPR data for short-term holders shows that some short-term capital is currently trading at a loss; if the price pulls back, there may be a risk of additional downside. Changes in institutional capital driven by shrinking ETF flows are also a potential trigger for volatility. The return of leveraged funds to the futures market is also worth watching. Investors should closely monitor key support levels, the movements of actively circulating on-chain funds, and changes in macro news, so they can grasp the market’s timing and stay up to date with more real-time market information.
GateNews1h ago
ADA Tests Key $0.230 Support While Upgrade Timeline Holds
Key Insights:
ADA trades at the wedge apex near $0.2387 as price compresses between $0.230 support and $0.245 resistance ahead of a decisive breakout move.
Protocol 11’s timeline remains intact despite the memory bug fix, keeping Cardano fundamentals stable while macro risks dominate short-t
CryptoNewsLand1h ago
