Bitcoin (BTC), Ethereum (ETH), and Ripple (XRP) experienced sideways movement during Wednesday’s trading session, after falling approximately 5%, 10%, and 5% respectively at the beginning of the week. The strong selling momentum pushed BTC below the psychological level of $90,000, while ETH and XRP closed below key technical support zones on the daily chart. Notably, the momentum indicators of the three largest market cap cryptocurrencies continue to signal negative, indicating increasing downward pressure and the potential for a deeper correction in the near future.
Bitcoin heads toward the $85,500 mark
Bitcoin’s price closed Sunday below the 61.8% Fibonacci retracement — established from the April low of $74,508 to the October all-time high of $126,199 — at $94,253. Subsequently, BTC continued to face strong selling pressure, dropping another 5.79% over the next two days and losing important support levels, including the 50-day exponential moving average (EMA) at $92,118 and the $90,000 mark, which was the upper boundary of the previous accumulation zone.
As of Wednesday, Bitcoin experienced a technical rebound when testing the median line of the sideways channel around $87,787. However, if the price fails to hold above this support zone and closes below, the correction trend is likely to extend toward the lower boundary of the consolidation channel at $85,569 — a level that coincides with the 78.6% Fibonacci retracement.
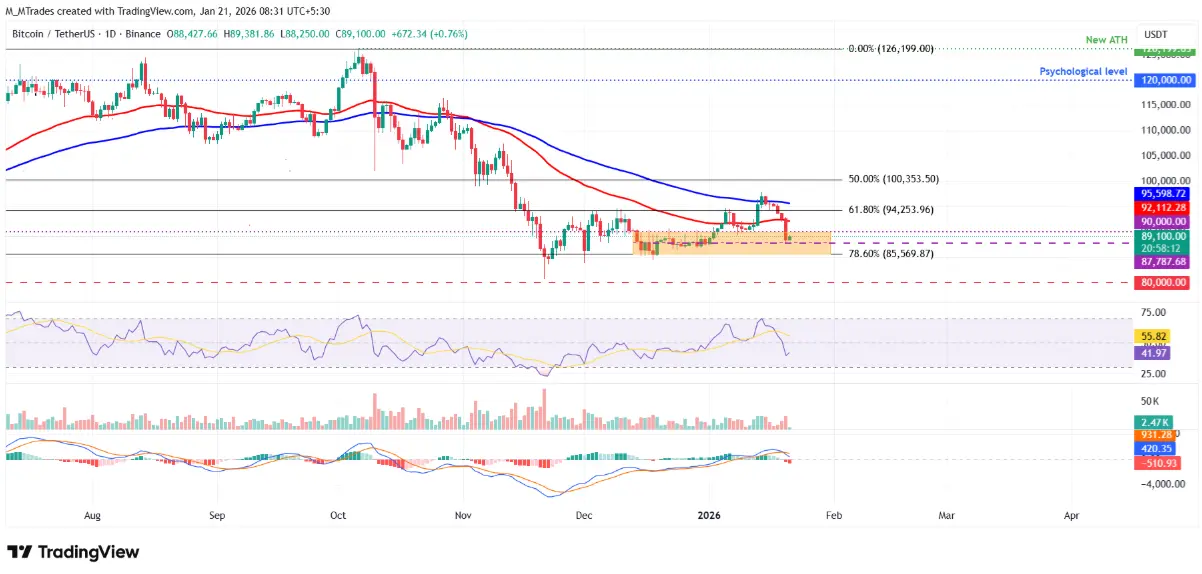 Daily BTC/USDT chart | Source: TradingView Momentum indicators are leaning towards a negative scenario. The Relative Strength Index (RSI) on the daily timeframe remains at 41, below the neutral threshold of 50, reflecting increasing selling pressure. Meanwhile, the MACD indicator has signaled a bearish crossover on Tuesday, further reinforcing the short-term bearish outlook.
Conversely, if buying interest returns strongly enough, Bitcoin could extend its recovery and test the key resistance zone at the 61.8% Fibonacci retracement level, corresponding to $94,253.
Ethereum may continue to correct
Last week, Ethereum faced strong selling pressure at the 200-day EMA around $3,334 and has since declined over 10%, closing below the daily support zone at $3,017 on Tuesday. As of Wednesday afternoon, ETH is trading around $2,966.
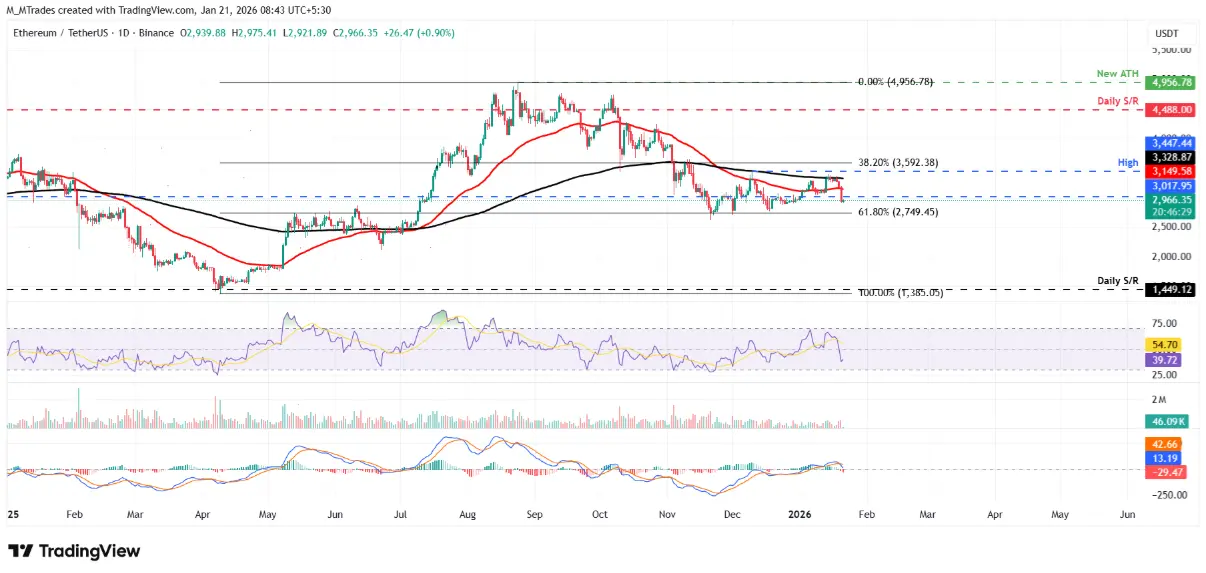 Daily ETH/USDT chart | Source: TradingView If the correction persists, the decline could extend to the 61.8% Fibonacci retracement level from the April low of $1,385 to the August all-time high of $4,956, approximately $2,749.45. Technical indicators such as RSI and MACD are also signaling increased selling pressure, similar to Bitcoin’s trend.
On the other hand, if Ethereum recovers, the nearest key resistance zone will be around $3,017, where the price could test the buying interest before deciding on the next direction.
XRP’s momentum indicators signal a deeper correction
On Friday, XRP failed to challenge the 50-day EMA at $2.05, then dropped over 9% and closed below the daily support level of $1.96 on Tuesday. As of writing on Wednesday, XRP is trading around $1.90.
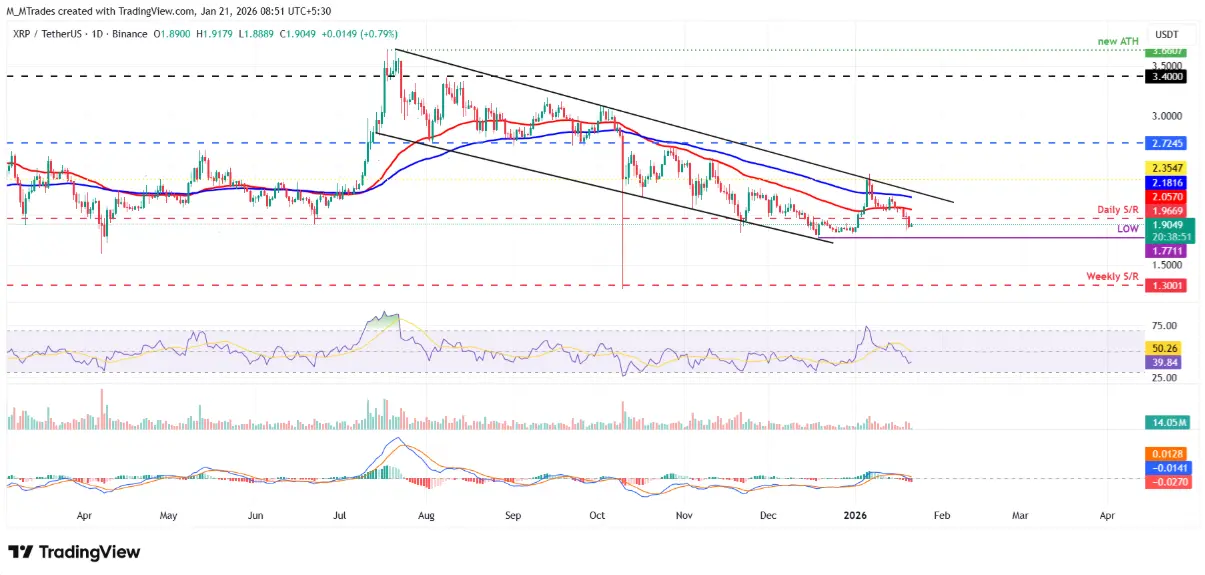 Daily XRP/USDT chart | Source: TradingView If the correction continues, the downward momentum could bring the price close to the December 19 low of around $1.77. Similar to Bitcoin and Ethereum, XRP’s momentum indicators such as RSI and MACD are also leaning towards a bearish scenario.
Conversely, if buying interest emerges, XRP could rebound, targeting the daily resistance at $1.96, opening opportunities for a recovery rally.
Disclaimer: The information on this page may come from third parties and does not represent the views or opinions of Gate. The content displayed on this page is for reference only and does not constitute any financial, investment, or legal advice. Gate does not guarantee the accuracy or completeness of the information and shall not be liable for any losses arising from the use of this information. Virtual asset investments carry high risks and are subject to significant price volatility. You may lose all of your invested principal. Please fully understand the relevant risks and make prudent decisions based on your own financial situation and risk tolerance. For details, please refer to
Disclaimer.
