Key Takeaways
-
OriginTrail (TRAC) has surged around 12% in a single day, drawing renewed attention to the token.
-
TRAC has broken out from an ascending triangle near $0.46 on the daily chart, signaling growing bullish momentum.
-
Similar breakout structures in July and October 2025 previously led to strong rallies of 63% and 113%.
-
Holding the $0.44–$0.46 zone as support will be crucial to keep the bullish fractal setup intact.
-
If the pattern plays out, TRAC could attempt a move toward its long-term ascending resistance above $1.00.
OriginTrail, the decentralized knowledge graph protocol, is stepping back into the spotlight as its native token TRAC records a strong 12% daily surge. Beyond the price jump, the real signal is coming from the charts, where a familiar fractal breakout structure is starting to emerge on the daily timeframe, hinting that a larger upside move could be forming.
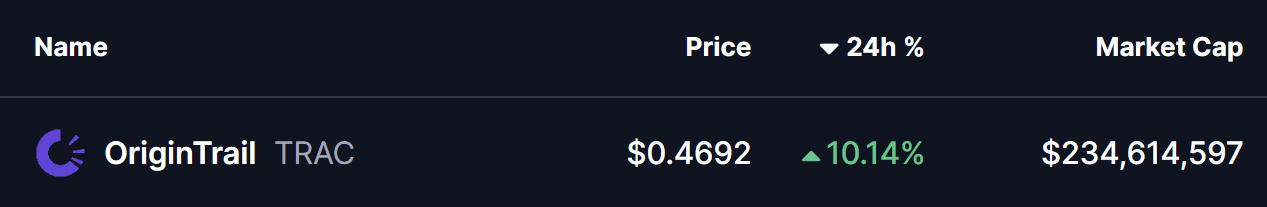
Source: Coinmarketcap
Fractal Breakout Hints at Potential Upside Move
On the daily chart, TRAC has confirmed a breakout from an ascending triangle pattern near the $0.46 level. This breakout is particularly important as price is now trading just above the 200-day moving average, a level that has historically acted as a major trend-defining zone for TRAC.
What makes this setup more compelling is its similarity to previous breakout phases. In late July 2025, a comparable structure resulted in a 63% upside move after price held above its breakout base. Later, in early October 2025, TRAC broke out from a right-angled descending broadening wedge pattern. That move was followed by a reclaim of the 200-day moving average and ultimately led to a powerful 113% rally.
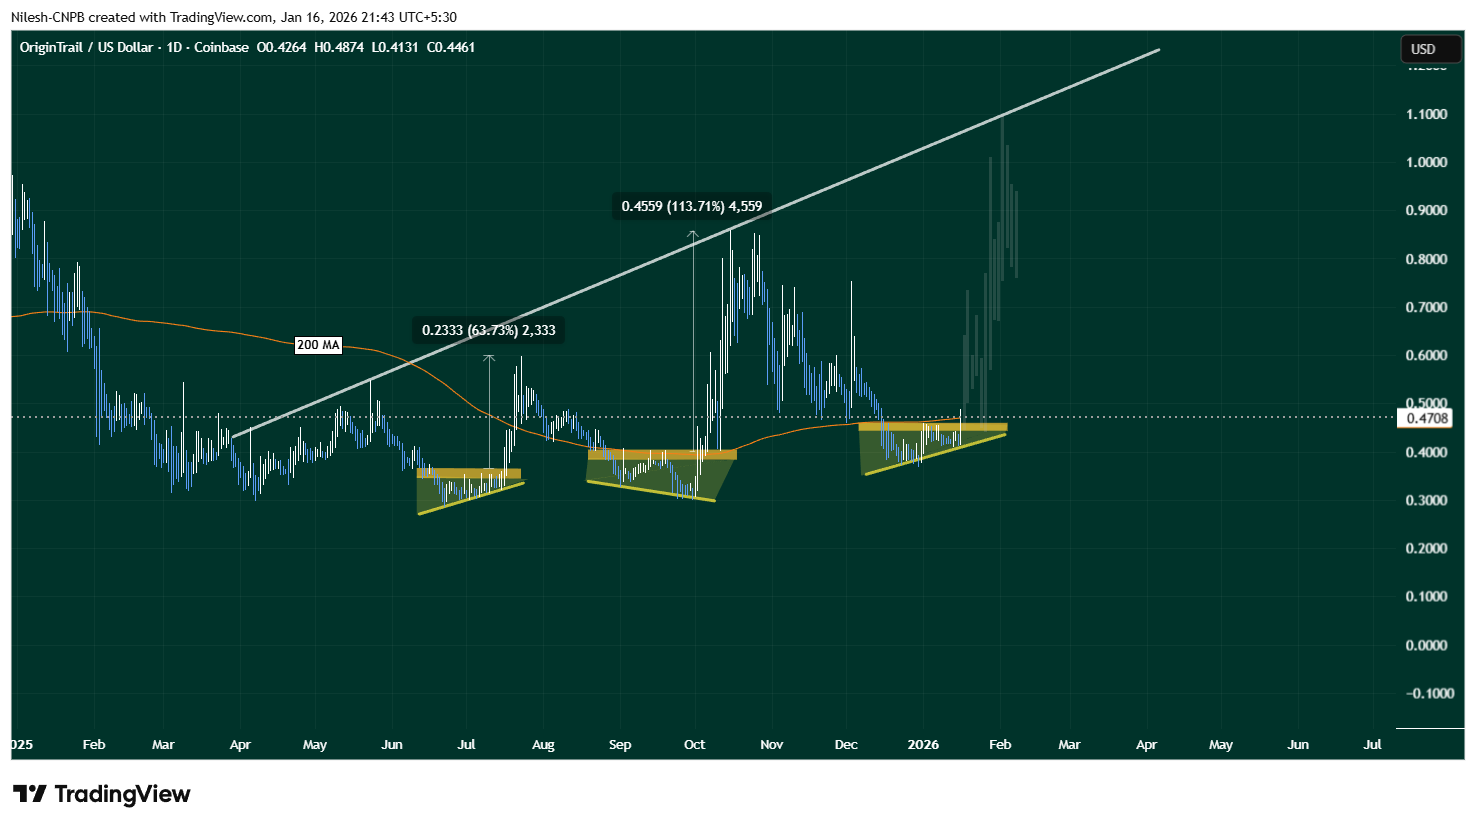
OriginTrail (TRAC) Daily Chart/Coinsprobe (Source: Tradingview)
The current setup shares key characteristics with those earlier moves. Price compression, a clean breakout, and interaction with the 200-day MA suggest that TRAC may once again be transitioning from consolidation into expansion.
What’s Next for TRAC?
If this fractal breakout plays out as expected, holding the $0.44–$0.46 zone as support will be crucial. A sustained hold above this range, along with continued strength above the 200-day moving average, could act as a launchpad for further upside.
In that scenario, TRAC may attempt a move toward its long-term ascending resistance trendline, which currently sits above the $1.00 level. A push toward that zone would align closely with the magnitude of prior fractal-driven rallies seen on the chart.
That said, fractal patterns are never guarantees. Broader market conditions, liquidity, and overall sentiment will continue to influence price action. A failure to hold the $0.44–$0.46 support zone or a rejection back below the 200-day moving average could invalidate the breakout and weaken the bullish fractal thesis.
Bottom Line
TRAC is showing early signs of another technically significant breakout, supported by historical fractal behavior and a reclaim of a key long-term moving average. If buyers can defend the current support zone, the chart suggests that OriginTrail may be positioning itself for a larger upside move in the weeks ahead.
Disclaimer: The views and analysis presented in this article are for informational purposes only and reflect the author’s perspective, not financial advice. Technical patterns and indicators discussed are subject to market volatility and may or may not yield the anticipated results. Investors are advised to exercise caution, conduct independent research, and make decisions aligned with their individual risk tolerance.
About Author: Nilesh Hembade is the Founder and Lead Author of Coinsprobe, with over 5 years of experience in the cryptocurrency and blockchain industry. Since launching Coinsprobe in 2023, he has been providing daily, research-driven insights through in-depth market analysis, on-chain data, and technical research.
Disclaimer: The information on this page may come from third parties and does not represent the views or opinions of Gate. The content displayed on this page is for reference only and does not constitute any financial, investment, or legal advice. Gate does not guarantee the accuracy or completeness of the information and shall not be liable for any losses arising from the use of this information. Virtual asset investments carry high risks and are subject to significant price volatility. You may lose all of your invested principal. Please fully understand the relevant risks and make prudent decisions based on your own financial situation and risk tolerance. For details, please refer to
Disclaimer.
Related Articles
REQ Soars 21.77% — What Does This Mean for Traders?
Request Network (REQ) surged 21.77% within an hour, reaching $0.0839 amid growing trader interest. Market conditions, bullish sentiment, and DeFi trends may be driving this rally, while traders monitor key resistance and support levels for future movements.
Coinfomania14m ago
Goldman Sachs Becomes Largest Holder of XRP ETFs With $153.8 Million in Holdings
Goldman Sachs becomes largest holder of XRP ETFs.
The entity now holds a total of $153.8 million in holdings.
This shows a promising future for the price of XRP.
The crypto community is thrilled to see the slight rise in crypto prices today. Presently, the price of Bitcoin (BTC), the p
CryptoNewsLand14m ago
BTC 15-minute decline of 0.61%: Major wallet selling pressure combined with negative US employment data triggers adjustment
Between 2026-03-12 14:15 and 14:30 (UTC), BTC price declined from 70660.0 USDT to 69917.2 USDT, with a 15-minute return rate of -0.61% and volatility reaching 1.06%. Trading volume increased sequentially, with market attention rising notably, and heightened fluctuations triggering alerts among short-term traders.
The primary driver of this price movement was on-chain whale wallets concentrating approximately 2,100 BTC inflows to exchanges within a short timeframe, representing an 18% increase compared to the previous period. Large holders' active position adjustments and concurrent large sell orders in spot and perpetual markets were simultaneously released.
GateNews33m ago
Stablecoin neo EURO captures only 0.35% of market supply
Stablecoins pegged to the EURO only represent 0.35% of total supply and less than 0.1% of total global trading volume, demonstrating limited market liquidity significance compared to USD stablecoins. Notable EURO stablecoins include EURC, EURCV, AEUR, EURI, and EURe.
TapChiBitcoin39m ago
ETH 15-minute rise of 0.72%: On-chain capital inflows and bullish sentiment dominating the market
2026-03-12 14:00 to 2026-03-12 14:15 (UTC), ETH spot price showed rapid upward movement with a 15-minute return rate of +0.72%, price range between 2065.45 to 2082.77 USDT, and overall volatility of 0.84%. During this market fluctuation, market attention increased, trading volume rose sequentially, and unilateral buy-side orders drove market sentiment to remain bullish.
The main driver of this price movement was large-scale on-chain capital inflows and the linkage effect between spot and futures markets. On-chain data shows multiple high-net-worth wallets
GateNews49m ago
Altcoin About to 10x? History Is Literally Repeating Itself
Crypto analysts suggest the altcoin market may be entering another expansion phase, similar to patterns seen in past rallies. While investor interest grows, indicators show the altcoin cycle hasn't begun yet, with high Bitcoin dominance and a low Altcoin Season Index.
Coinfomania1h ago