Bitcoin (BTC) can establish a support zone at the $100,000 level and continue breaking through to $107,000 in the coming days, driven by a combination of positive technical indicators and solid fundamental fundamentals.
Ascending Triangle Pattern and Bullish Crossover Signal Enhance BTC’s Recovery Prospects
Last week, Bitcoin confirmed the breakout from a rising triangle pattern that had lasted for several weeks, entering a phase of retesting after the breakout as per theory. After surpassing the resistance zone around $95,000, BTC retested this price area as a new support before rebounding. This is a common move in genuine breakouts, helping to reinforce the upward trend.
Maintaining this newly established price zone not only preserves the “true breakout” structure but also keeps the theoretical upside target around $107,000, calculated by adding the triangle’s maximum height to the breakout point, expected to be reached in February.
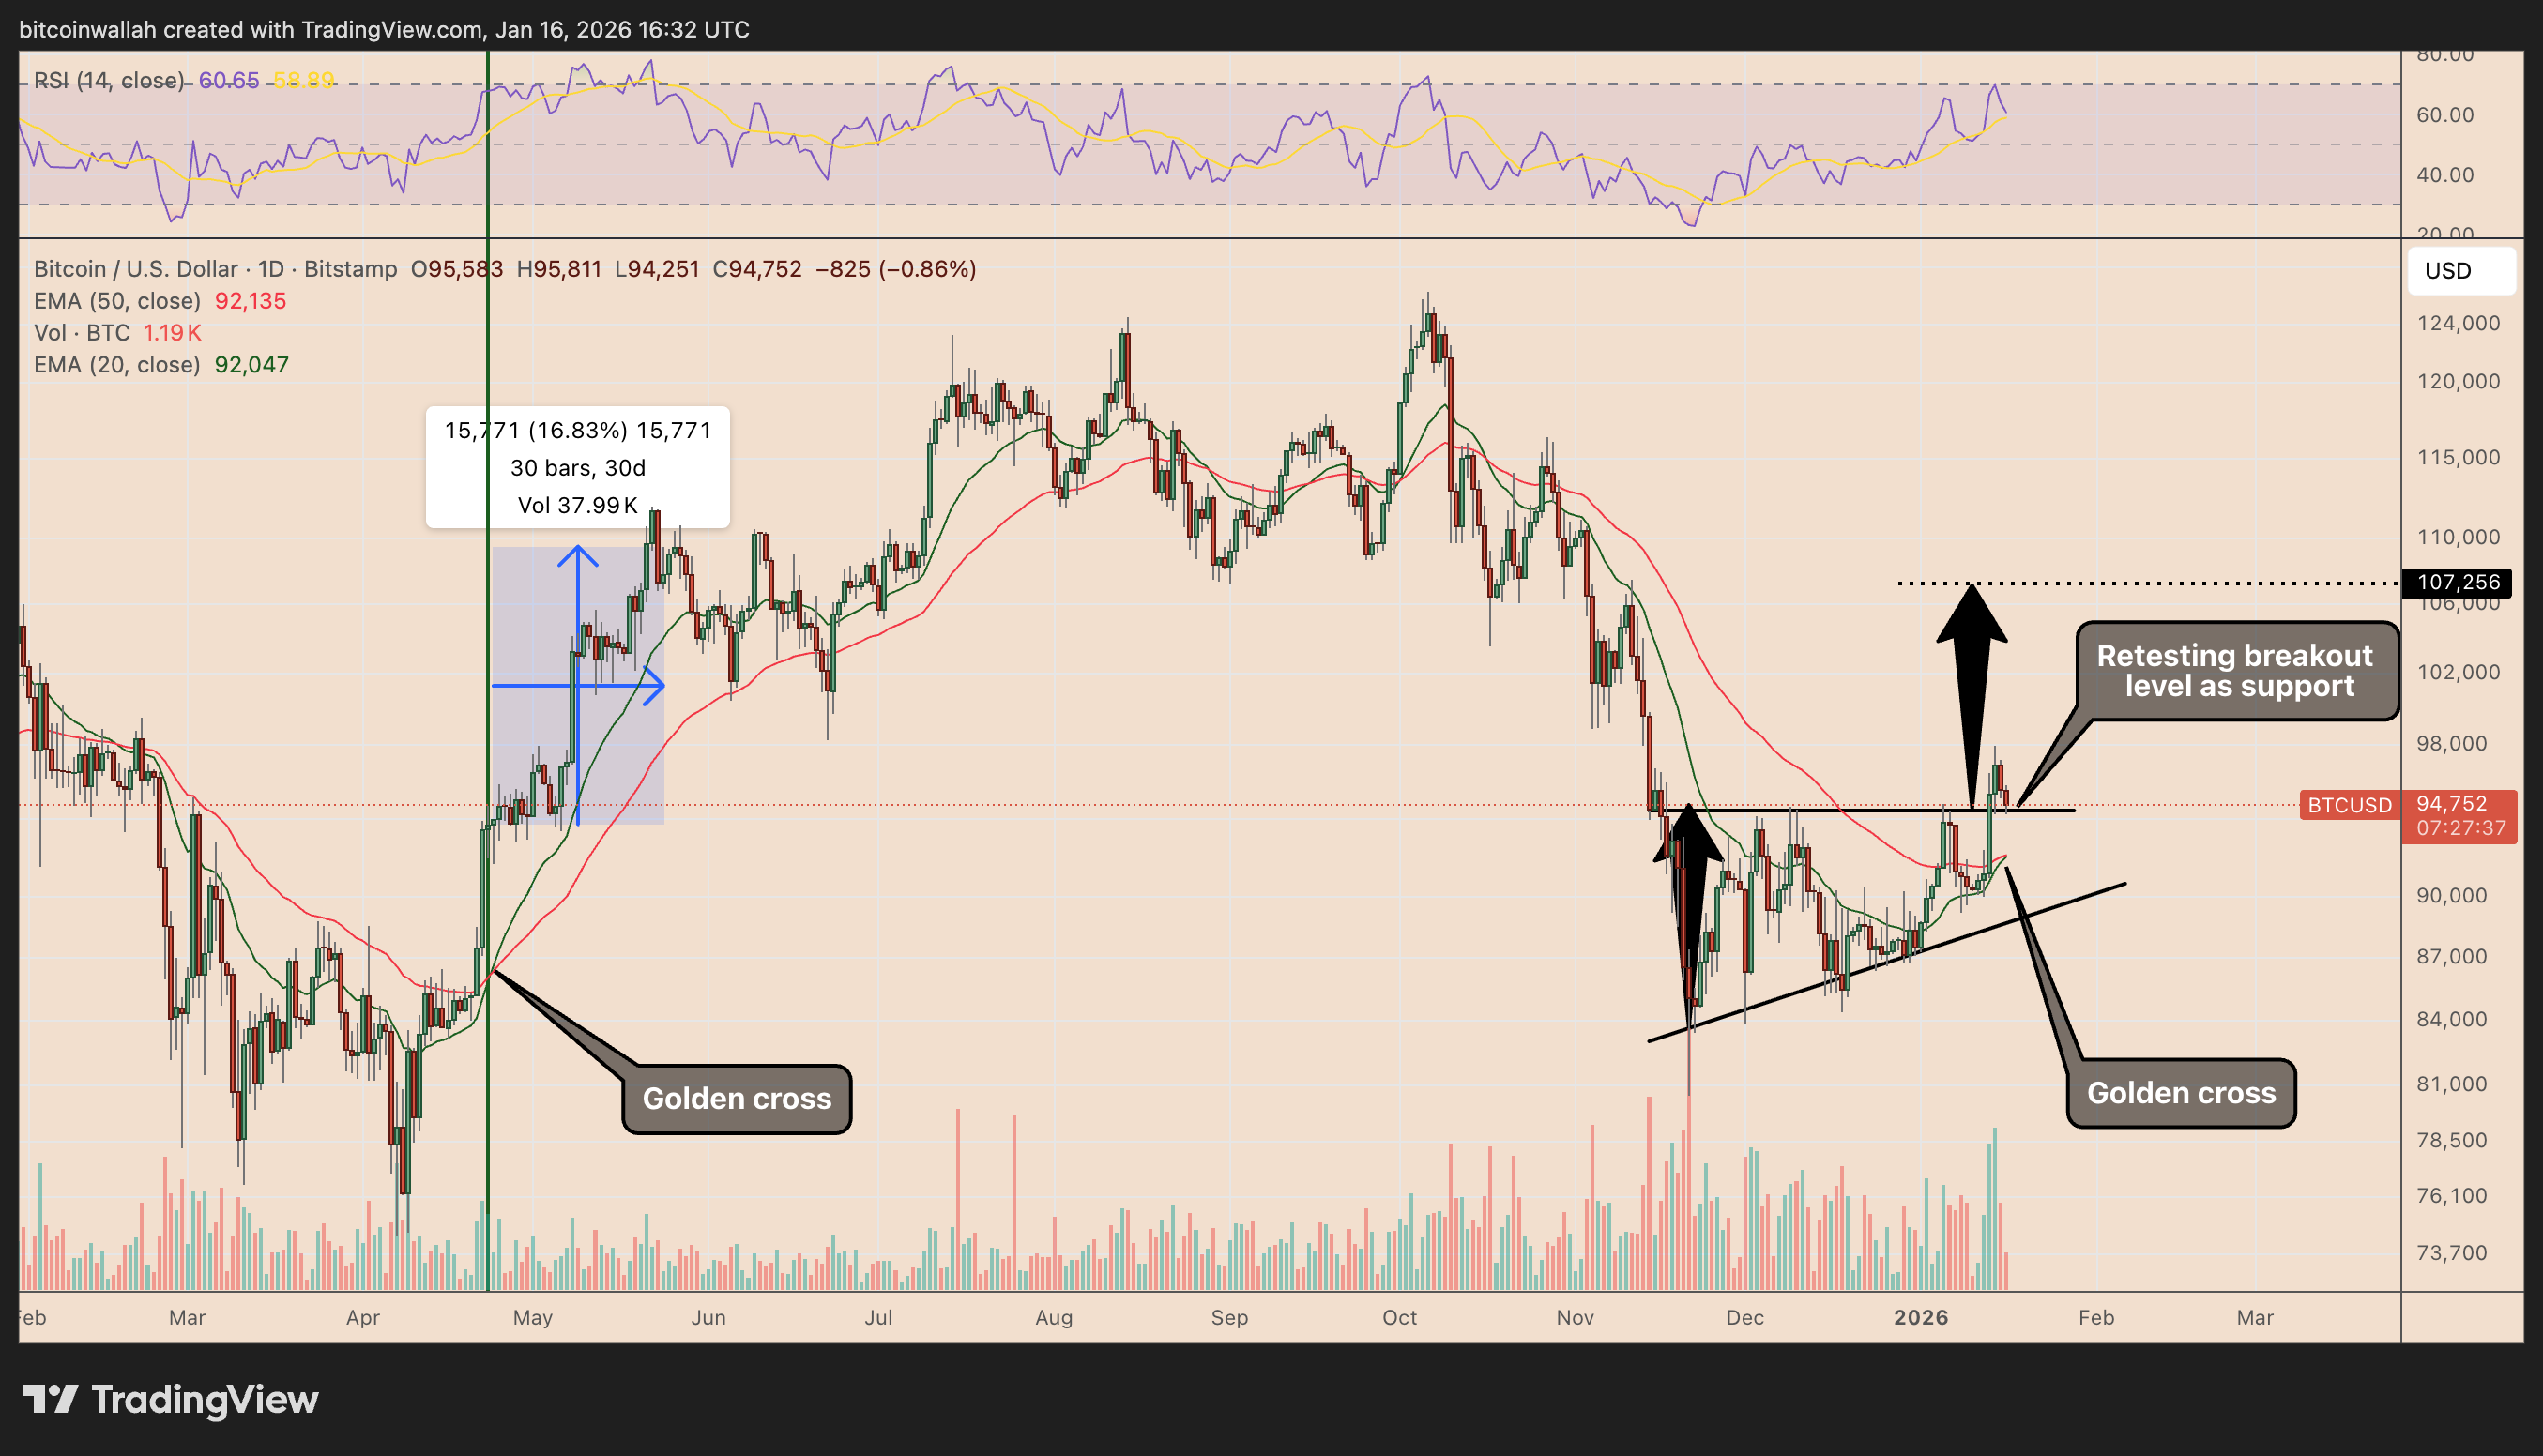 Daily BTC/USD Chart | Source: TradingViewFrom a technical perspective, Bitcoin’s daily chart is also approaching a bullish crossover signal between the 20-day (EMA) and 50-day (EMA). The last time this signal appeared, BTC’s price increased by approximately 17% within a month, further supporting the potential continuation of the trend if the signal is confirmed.
Strong Decline in Selling Pressure from Long-Term Holders
Bitcoin’s upward momentum is further strengthened as selling pressure from long-term investors continues to decline. Data tracking UTXOs spent by long-term holders (coins held for over 5 years) shows that the distribution rate at recent local peaks has decreased significantly.
As of January 2026, the 90-day moving average of BTC spent reached nearly 2,300 BTC at the start of the cycle, then gradually decreased to around 1,000 BTC, reflecting a sharp reduction in coins entering the market.
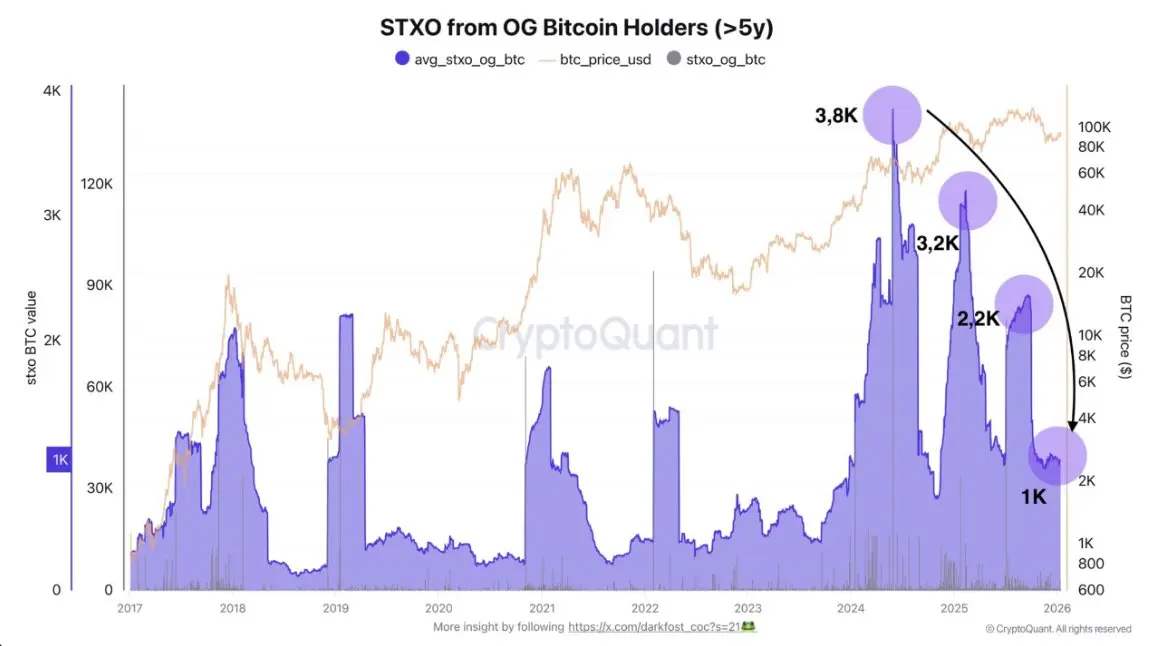 STXO from long-term Bitcoin holders (over 5 years) | Source: CryptoQuantIn the early stages of the rally, selling activity by long-term holders spiked to unprecedented levels compared to previous bull markets, mainly driven by demand from spot ETFs, deep market liquidity, and strong institutional participation.
Analyst DarkFrost commented: “This indicates that long-term holders have slowed their selling. The selling pressure from this group could be significantly reduced, and the current trend favors holding rather than distributing.”
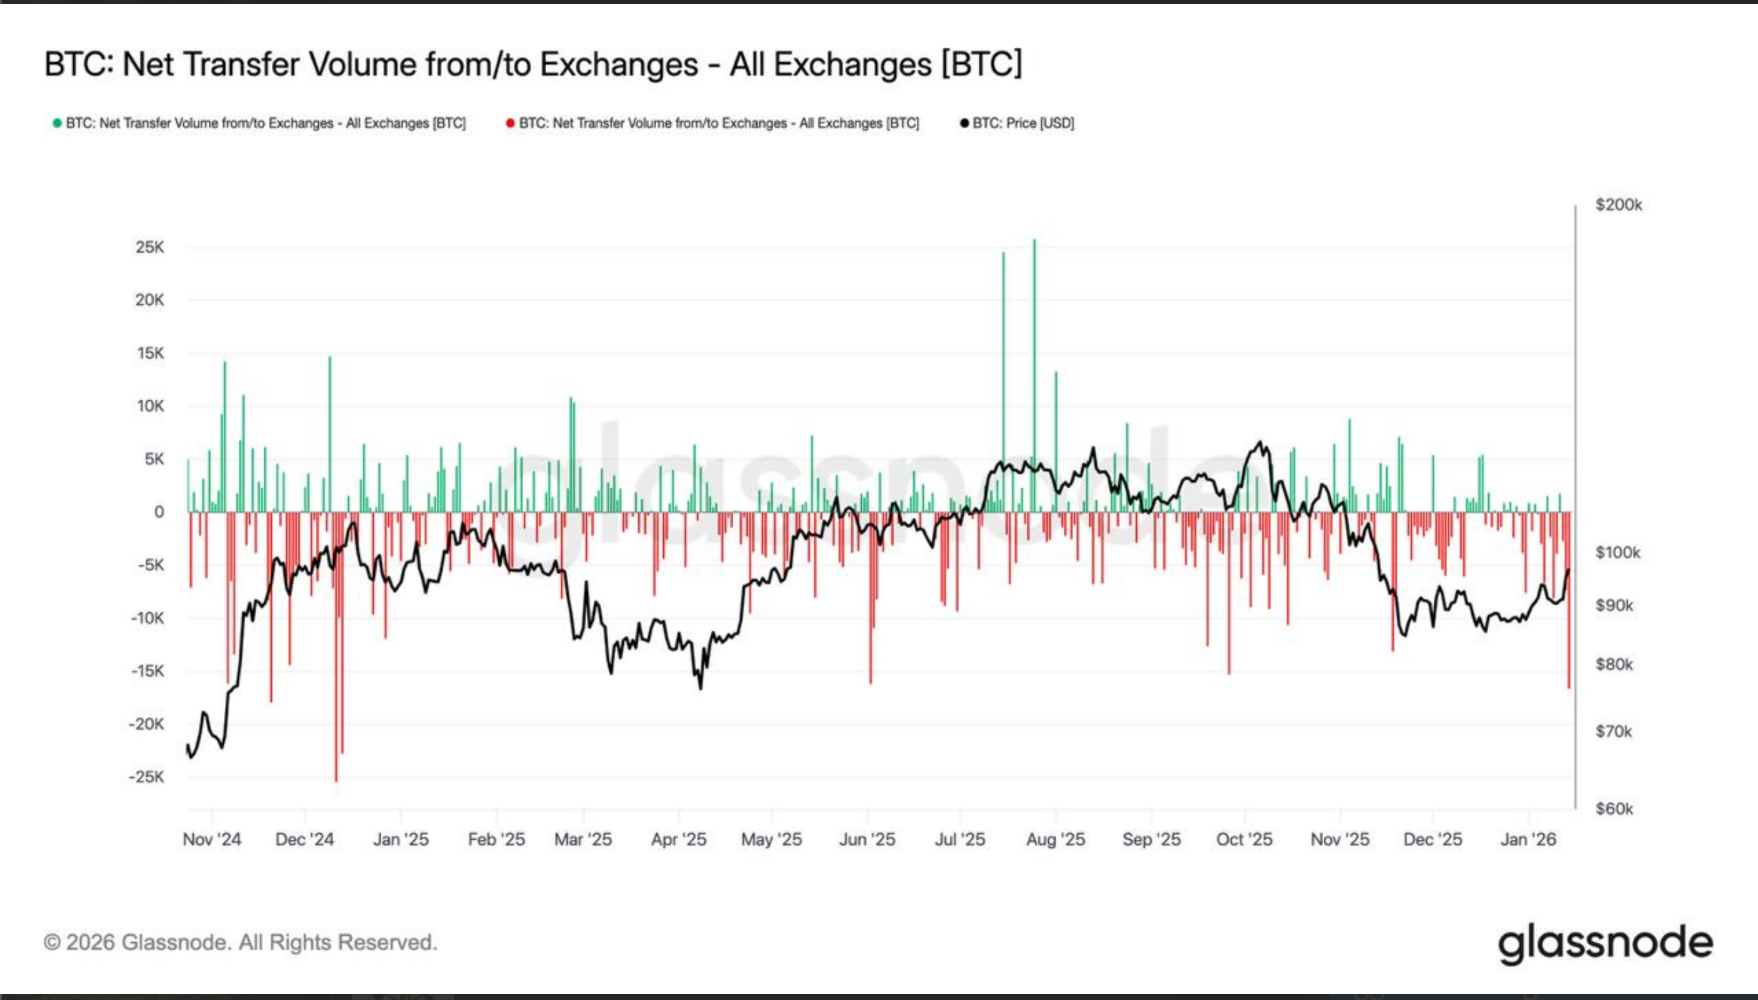 Net BTC transfer volume to/from exchanges | Source: GlassnodeThe slowdown in selling activity also coincides with the highest net Bitcoin withdrawals from exchanges since December 2024.
Negative Correlation Between Bitcoin and Gold: A Positive Signal for BTC
Another notable macro signal supporting the breakout thesis is the historical relationship between Bitcoin and gold. In the past, when the correlation between BTC and gold turned negative, Bitcoin typically experienced an average increase of 56% within just two months. The only exception was in May 2021, due to external shocks, including China tightening mining operations and the market being forced to reduce leverage.
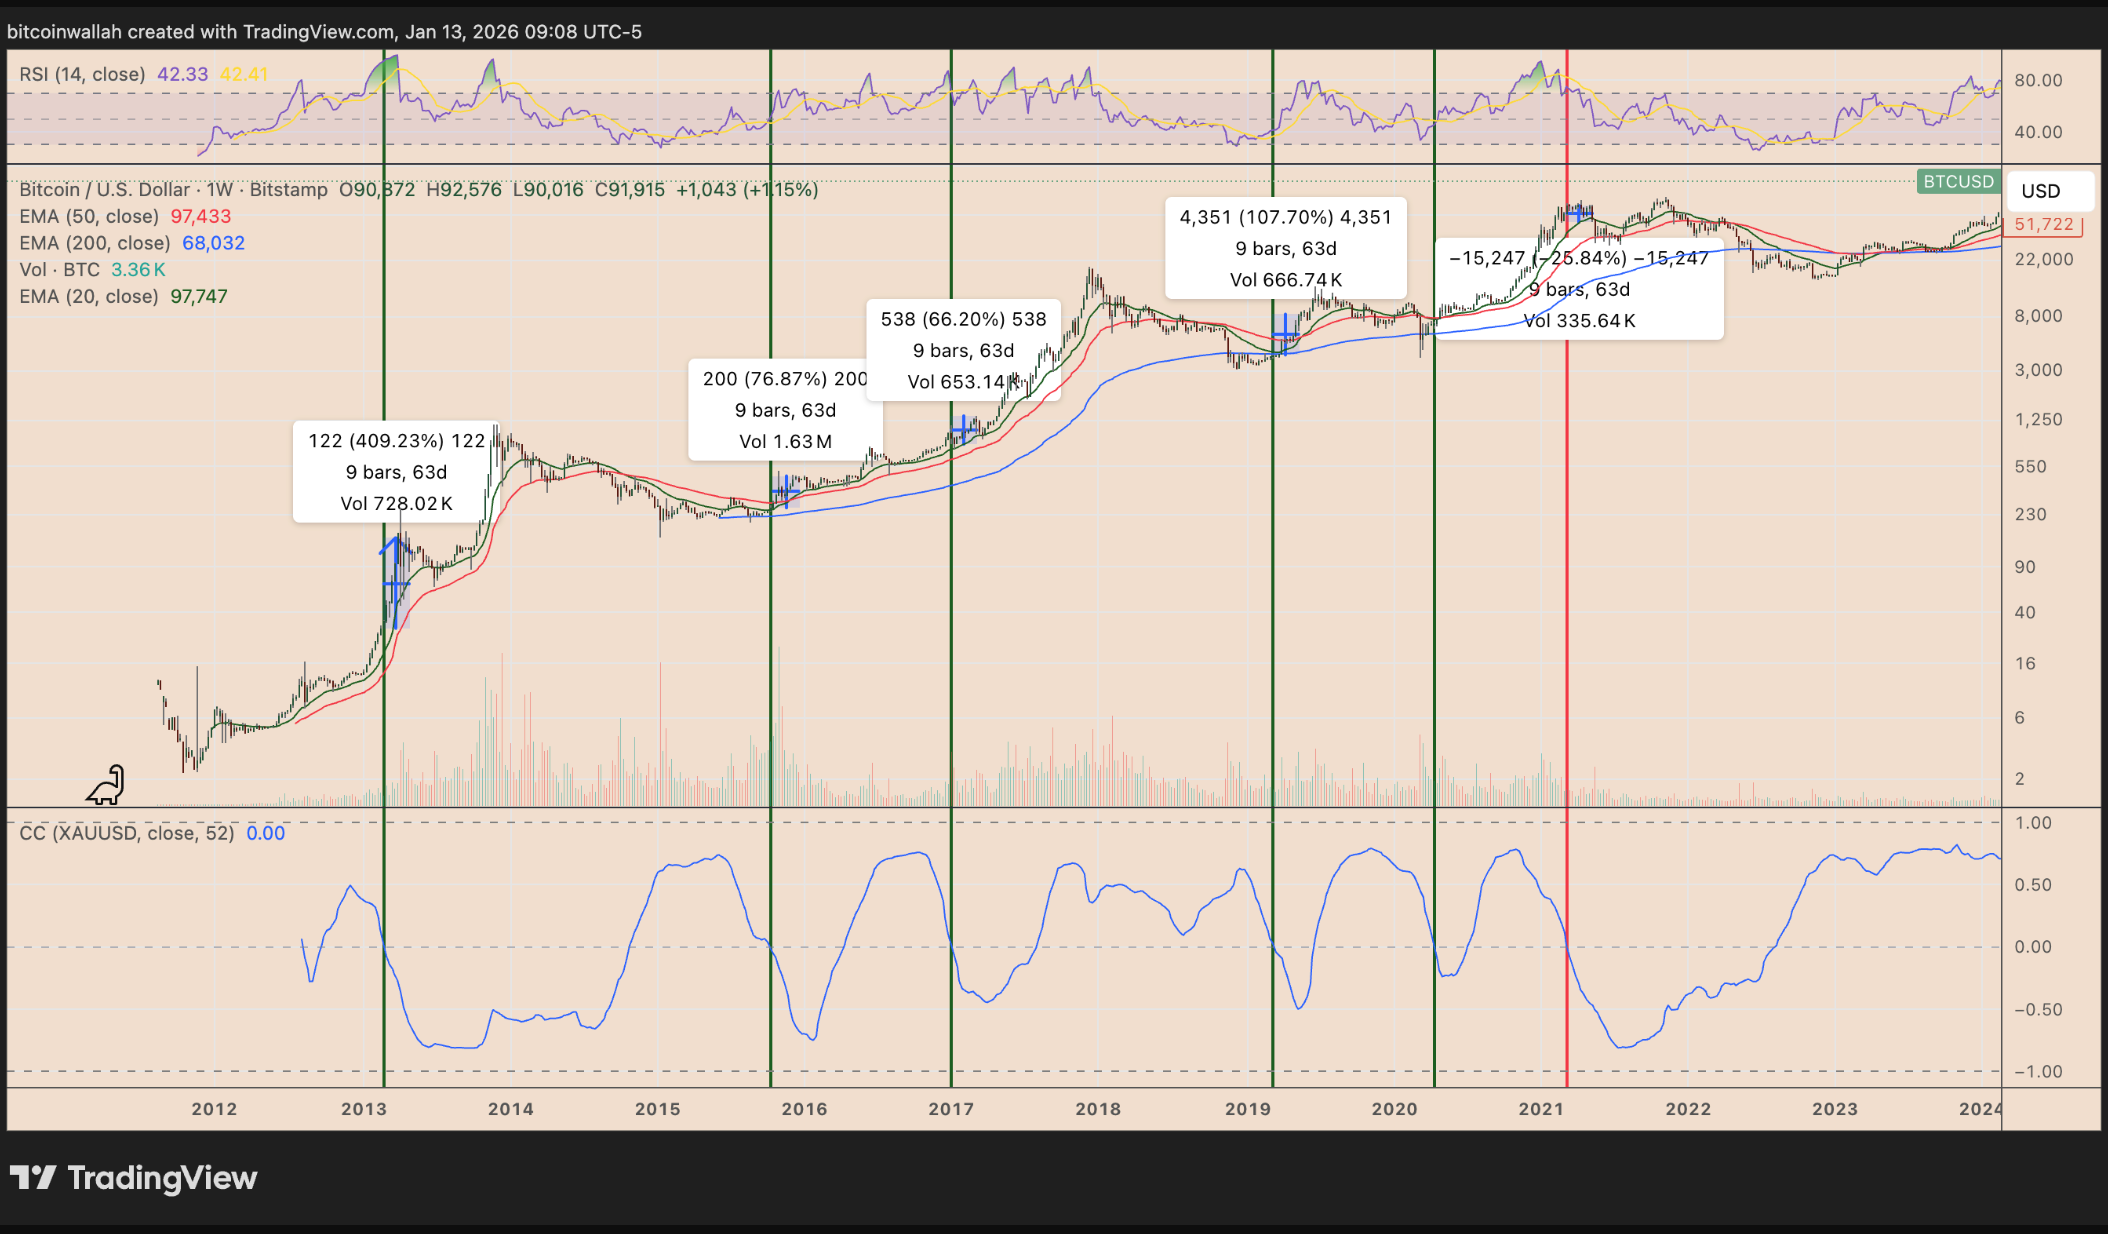 Weekly BTC/USD Chart | Source: TradingViewThe outlook for 2026 is considered more favorable, thanks to increased global liquidity and the end of the Federal Reserve’s quantitative tightening policy (Fed).
Matt Hougan from Bitwise stated that Bitcoin’s bullish cycles in history have always been associated with the expansion of the global M2 money supply. He believes that the current monetary easing cycle could help Bitcoin outperform gold in 2026, while also strengthening the potential to break higher levels in the near future.
Disclaimer: The information on this page may come from third parties and does not represent the views or opinions of Gate. The content displayed on this page is for reference only and does not constitute any financial, investment, or legal advice. Gate does not guarantee the accuracy or completeness of the information and shall not be liable for any losses arising from the use of this information. Virtual asset investments carry high risks and are subject to significant price volatility. You may lose all of your invested principal. Please fully understand the relevant risks and make prudent decisions based on your own financial situation and risk tolerance. For details, please refer to
Disclaimer.
Related Articles
Yesterday, Bitcoin spot ETF net outflows totaled $124 million, with BlackRock’s IBIT seeing net inflows of $40.67 million against the trend.
On April 8, Bitcoin spot ETF saw net outflows of $124 million. BlackRock’s IBIT had net inflows of $40.67 million, Fidelity’s FBTC had net outflows of $79.12 million, Ark’s ARKB had net outflows of $74.70 million, Grayscale’s GBTC had net outflows of $11.10 million, and the flows for the remaining institutions were all zero.
GateNews2m ago
Iran Demands Bitcoin Payments for Strait of Hormuz Oil Tanker Transit Fees During Ceasefire
Iran is imposing transit tolls on oil tankers passing through the Strait of Hormuz during the two‑week ceasefire with the United States, requiring payments in bitcoin (BTC) at a rate of approximately $1 per barrel — a fully loaded supertanker facing charges up to $2 million.
CryptopulseElite8m ago
Bitcoin Depot discloses a critical security vulnerability; hackers stole $3.6 million in BTC
Bitcoin Depot was hit by a security vulnerability on March 23, 2023. The hacker gained access to the IT system to steal login credentials, and without authorization transferred about 50.9 bitcoins, resulting in losses of approximately $3.67M. The incident did not affect customers’ personal data, showing the security challenges faced by Bitcoin ATM operators. This was the company’s second known major security incident, reflecting its need for stronger security measures under regulatory pressure.
MarketWhisper26m ago
Derivatives contract whale “sets 10 big targets first,” flipping a losing short position into a profit, with an unrealized gain of $1.968 million
According to on-chain analysts’ monitoring, the short position of the contract whale “first sets 10 major targets” has already generated a profit of $1.97M, holding 2,201.507 BTC shorts and 7,093 ETH shorts, with a total size of $173 million. The BTC stop-loss range is $73,000 to $73,500.
GateNews56m ago