RIVER up 12% in a single day to $18.69, rebounding 216% from the $7 low point over the past week. RSI has remained in the overbought zone above 70 for a long time, ignoring warning signals from the bulls. Open interest has surged from 75 million to 108 million, with Binance perpetual contracts accounting for $20 billion of the trading volume. The 24-hour trading volume has decreased by 10%, indicating a volume contraction while prices rise, hiding potential risks. Support levels are at $17.35 and $14.28, resistance at $21.71.
Abnormal strength and technical divergence across multiple timeframes
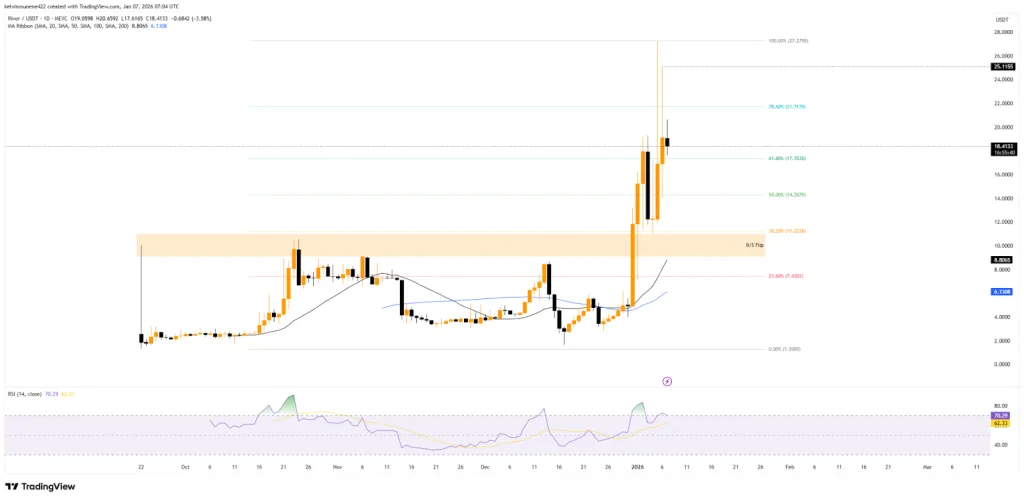
(Source: Trading View)
RIVER continued its strong rally at the start of the new year on Wednesday, rising another 12% in the past 24 hours. Despite obvious signs of market overheating, buyers remain strong. At press time, the token’s price approaches $18.69, with a market cap of approximately $366 million, solidifying its position as one of the top short-term performers in the sector.
Higher timeframe charts show an unusually stable trend. The weekly gains have already exceeded the recent low point of 216%. Typically, such rapid gains would revert quickly, but no signs of correction have appeared yet. The monthly chart is even more impressive, with gains over 340%. Year-to-date, the increase is nearly 469%, capturing traders’ full attention on the order book.
The 20-day moving average is well below the current price, near $8.82, while the 50-day moving average hovers around $6.13. These levels have not been tested for several days. The gap between price and moving averages is large enough that any pullback could be viewed as normal market fluctuation rather than a structural threat. Such a significant divergence from moving averages is usually a warning in technical analysis, but the bulls seem to ignore this conventional rule.
However, this rally is beginning to show signs of fatigue. The Relative Strength Index (RSI) has mostly hovered around 70 in January, indicating an extremely strong upward momentum. When indicators stay in overbought territory for a long time, markets often correct, but timing such a correction is difficult. RIVER’s case is even more extreme, with RSI not only overbought but also remaining in the overbought zone for weeks, a rare phenomenon in crypto history.
RIVER Multi-timeframe Gains Summary
24 hours: +12%, trading at $18.69
Weekly: +216%, rebounded from $7 low
Monthly: +340%, remarkable monthly performance
Yearly: +469%, top annual gain
Contradictory signals of volume contraction, rising prices, and surge in open interest
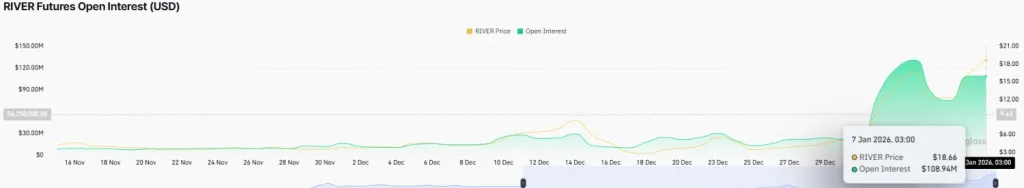
(Source: Coinglass)
Volume changes add another layer of complexity. RIVER’s 24-hour trading volume has decreased by nearly 10%, to about $37 million, indicating a slight decline in trader activity after the recent rally. This volume contraction amid rising prices is often a warning sign in technical analysis, suggesting the rally is supported mainly by a few large players or leveraged positions.
However, derivatives market data tell a different story. On-chain trading and derivatives activity further fueled RIVER’s rise. According to CoinGlass data, Binance’s perpetual contracts contributed the majority of the 24-hour derivatives volume, with about $2 billion out of a total $3.5 billion. During this period, over 12.9 million trades occurred, showing heavy leverage use and liquidity being pushed far beyond what the spot market can support.
Open interest also confirms this trend. It jumped from about $75 million on January 5 to over $108 million, typically indicating new positions being established rather than old ones being closed. This shift often reflects market confidence in its own momentum. However, concentration on a single platform can amplify emotional swings.
Activity around Binance is highly concentrated, which introduces certain risks. While liquidity is ample, positions may become one-sided, leading to larger volatility. When $20 billion in trading volume is concentrated on one platform, any technical issues or policy changes could trigger sharp swings.
Key technical levels and risk management strategies
Despite this, key technical zones remain clear. Support levels are first at around $17.35, near the 61.8% Fibonacci retracement; second at about $14.28, near the 50% Fibonacci level. If prices fall further, the $11.22 zone will come into view, which previously saw a breakout; a retest here would test support validity.
On the upside, extension lines suggest potential targets around $21.71. If momentum resumes, prices could further rise to approximately $25.11. These targets are based on Fibonacci extensions and previous highs, offering technical reference points.
For traders, RIVER currently presents a high-risk, high-reward scenario. The multi-timeframe uptrend, support levels, and increased derivatives participation all support a strong momentum, even as momentum indicators show signs of fatigue. As volume declines and leverage increases, upcoming trading sessions may reveal whether the market is preparing for consolidation or continuing higher.
Conservative investors should wait for RSI to revert to normal ranges and for volume to expand before entering. Aggressive traders might consider small positions to chase the rally, but must set strict stop-losses below $17.35, with a target at $21.71, risking a reward ratio of about 1:2. The most dangerous approach is to chase high with heavy positions when RSI is overbought, volume is contracting, and leverage is high—such operations often end in liquidation historically.
Disclaimer: The information on this page may come from third parties and does not represent the views or opinions of Gate. The content displayed on this page is for reference only and does not constitute any financial, investment, or legal advice. Gate does not guarantee the accuracy or completeness of the information and shall not be liable for any losses arising from the use of this information. Virtual asset investments carry high risks and are subject to significant price volatility. You may lose all of your invested principal. Please fully understand the relevant risks and make prudent decisions based on your own financial situation and risk tolerance. For details, please refer to
Disclaimer.
Related Articles
BTC drops 0.52% in 15 minutes: Whale inflows to exchanges combined with insufficient liquidity amplify sell pressure
From 2026-04-17 10:15 to 2026-04-17 10:30 (UTC), the BTC price rapidly fell within the 75214.3 – 75725.9 USDT range. The cumulative return over 15 minutes was -0.52%, and the amplitude reached 0.68%. During this period, market sentiment shifted from cautious to bearish, volatility on the board increased, mainstream trading pairs saw an increase in主动 sell-side volume, buy-side acceptance became constrained, and overall trading activity declined significantly.
The primary driver behind this unusual move is that large holders (whales) concentrated their short-term inflows into exchanges. On-chain data shows that net inflows to addresses holding more than 1000 BTC per address changed from a steady state to a positive value, directly boosting exchange balances over the short term. Historical data indicates that whale inflows to exchanges are highly correlated with sell pressure in the medium to short term. In the same period, order book snapshots reflected a significant increase in the volume of主动 sell orders, and the成交价梯度 shifted downward, highlighting that weak market absorption capacity caused a short-term drop in price.
In addition, in the derivatives market, the long/short positioning structure tilted toward shorts. The number of主动 sell contracts exceeded that of buys in a short time, and rising pressure to close long positions further intensified the downtrend. Market liquidity overall was relatively weak; the number of active addresses over the past 10 minutes was only about 42k, and both fees and the mempool were near their lowest levels of the recent month. Against a backdrop of insufficient capital absorption, the marginal impact of large sell orders was amplified. On the macro front, the Federal Reserve’s monetary policy tightening and industry media repeatedly downgraded BTC’s near-term expectations led investors’ risk appetite to generally decline, creating a resonance at the level of market sentiment.
In the short term, it is still necessary to stay alert to liquidity risk and the price impact of one-way large transactions in specific trading pairs. Going forward, focus on key developments such as changes in whales’ on-chain holdings, exchange balances, and rebounds in activity metrics, as well as the potential impact of macro policy direction on risk assets. Relevant users should primarily guard against the risk of sharply amplified short-term price volatility and promptly track more market information.
GateNews1h ago
Popular Analyst Remains Aggressively Bullish on Crypto Prices, Predicts Parabolic Surges Soon
Popular analyst remains aggressively bullish on crypto prices.
The expert then predicts parabolic surges soon.
The move could spark dead coins into pumping heavily as well.
The crypto community continues to hold
CryptoNewsLand1h ago
RAVE, SIREN Rally Despite Manipulation Warnings
Rave DAO and Siren tokens surged to near all-time highs, facing volatility and liquidation risks. Concerns grew over potential market manipulation and supply concentration, particularly for RAVE. A new KuCoin listing boosted RAVE's visibility, despite inherent trading risks.
CryptoFrontier1h ago
ETH rises 0.65% in 15 minutes: ETF fund inflows and leverage long accumulation resonate to lift spot prices
Between 2026-04-17 09:15 and 2026-04-17 09:30 (UTC), ETH fluctuated within the 2351.53 to 2376.99 USDT range. The 15-minute return recorded +0.65%, with a swing of 1.08%. Within this range, buying pressure significantly strengthened, with trades dominated by medium-sized orders, which increased market attention and amplified short-term volatility.
The main drivers behind this anomaly are continued inflows of institutional capital into ETH spot ETFs, especially with cumulative net inflows over the past 4 days exceeding $212 million. On April 17 alone, the ETF added an additional $9.5 million in inflows, and spot buy orders expanded in sync within 15 minutes. Leveraged long positions in the derivatives market are the second-largest catalyst. From April 14 to 17, ETH futures open interest grew 26% week over week, indicating that capital via multiple paths is simultaneously betting on an upside move. The funding rate being neutral suggests the leveraged structure is temporarily healthy.
In addition, global macro market risk appetite has rebounded (geopolitical tensions easing, and the Federal Reserve keeping rates unchanged), driving a broad rebound across mainstream risk assets, and the crypto market has attracted liquidity accordingly. At the industry level, major financial institutions are advancing filings for ETFs and trust products. Mining companies have increased their ETH holdings and also maintained active staking activity, further reinforcing medium- to long-term market expectations. Multiple factors overlap and resonate, amplifying volatility. On-chain transfers remain generally stable, and there is no abnormal concentration of fund flows migrating between exchanges.
What needs attention is that although the current market is lifted by the resonance of institutional capital and leverage, the continuous growth of futures positions combined with the spot price failing to rise above the 2400 USDT area will bring the risk of forced liquidation. Meanwhile, if ETF subscription inflows slow down or macro liquidity reverses, ETH spot support could weaken. Please focus on tracking ETF net inflows, changes in futures open interest, the macro news backdrop, and nearby support and resistance levels, and stay alert to short-term volatility and potential abrupt adjustments. For more real-time market information, please keep watching.
GateNews2h ago
BTC up 0.58% in 15 minutes: exchange net outflows and ETF buy orders converge to lift the price
Between 2026-04-17 08:45 and 2026-04-17 09:00 (UTC), the BTC price surged in the short term. The candlestick return was +0.58%, with a price range of 75265.0 - 75862.3 USDT and a range of 0.79%. Market volatility increased and attention rose, with trading volume significantly higher than usual, reflecting a convergence between capital flow and technical signals.
The main driver behind this unusual move is the exchange’s net outflow of BTC in sync with ETF capital inflows. Data shows that within the past 24 hours, exchanges recorded a net outflow of 2,844.68 BTC
GateNews2h ago
Citi Study: Bitcoin and Gold Together Outperform Single Asset Allocation in Long-Term Portfolios
A Citi study recommends combining Bitcoin and gold in investment portfolios for improved long-term returns, noting better performance in various market conditions. Wells Fargo predicts gold could rise to $8,000 by 2027, driven by central bank concerns. Meanwhile, Bitcoin funding rates have reached lows, historically marking turning points.
GateNews2h ago
