
As the new year 2026 begins, the broader cryptocurrency market has shown modest strength over the past few hours, with both Bitcoin (BTC) and Ethereum (ETH) turning slightly green. This improvement in sentiment has started to spill over into the altcoin market as well, with several tokens attempting to build upward momentum — including Render (RENDER).
RENDER is currently up around 4% on the day, but the more compelling development lies beneath the surface. On lower timeframes, price action is beginning to highlight a constructive bullish structure that could soon pave the way for a meaningful breakout if confirmed.
Source: Coinmarketcap
Ascending Triangle Structure Takes Shape
On the 4-hour chart, RENDER appears to be forming a textbook ascending triangle, characterized by a sequence of higher lows pressing steadily against a well-defined horizontal resistance zone. This structure is widely viewed as a bullish continuation pattern, particularly when it develops after a period of consolidation and shows signs of accumulation.
RENDER recently faced rejection near the $1.36 neckline resistance, which pushed price back toward its rising support trendline around the $1.28 region. However, each pullback has been met with strong buying interest, keeping the pattern intact and preventing any deeper breakdown. This behavior suggests that sellers are gradually losing control as buyers continue to step in at higher levels.
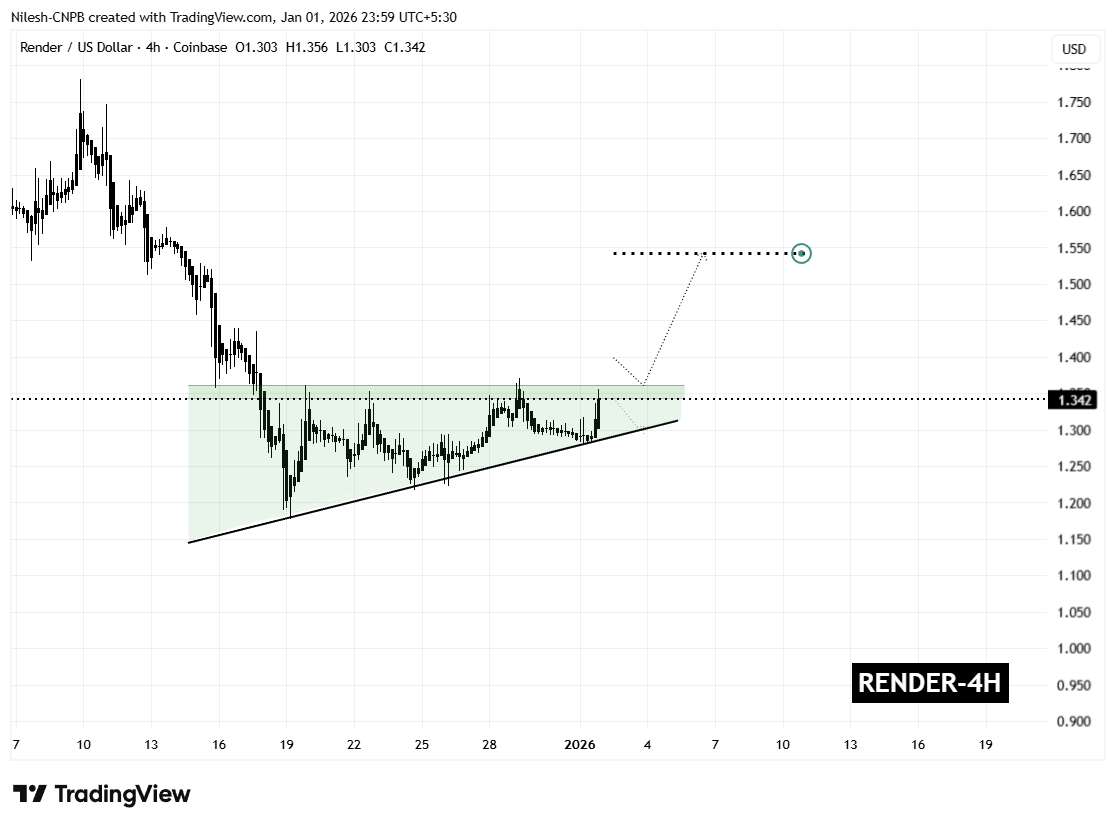
Render (RENDER) 4H Chart/Coinsprobe (Source: Tradingview)
The latest rebound has carried RENDER back toward the upper boundary of the pattern, reinforcing the idea that demand remains firm. Rather than signaling weakness, this price action points to healthy consolidation as the market tightens ahead of a potential breakout.
What’s Next for RENDER?
From here, RENDER appears to be preparing for another test of the $1.36 resistance zone. A confirmed breakout and sustained close above this level, ideally followed by a successful retest as support, would validate the ascending triangle structure and likely trigger a bullish expansion phase.
Based on the measured move of the pattern, the technical upside projection points toward the $1.54 region. This target represents a potential upside of roughly 14% from current levels and also aligns with previous price structure, strengthening the bullish case.
That said, caution remains warranted. A failure to break above resistance could result in a pullback toward the rising support trendline. As long as that trendline continues to hold, the broader bullish structure would remain intact. A decisive breakdown below support, however, would invalidate the pattern and delay any breakout scenario.
For now, the combination of improving market sentiment, persistent buying pressure, and a tightening ascending triangle structure suggests that Render is approaching a critical decision point — one that could define its next significant move as 2026 gets underway.
Disclaimer: The views and analysis presented in this article are for informational purposes only and reflect the author’s perspective, not financial advice. Technical patterns and indicators discussed are subject to market volatility and may or may not yield the anticipated results. Investors are advised to exercise caution, conduct independent research, and make decisions aligned with their individual risk tolerance.
About Author: Nilesh Hembade is the Founder and Lead Author of Coinsprobe, with over 5 years of experience in the cryptocurrency and blockchain industry. Since launching Coinsprobe in 2023, he has been providing daily, research-driven insights through in-depth market analysis, on-chain data, and technical research.
Disclaimer: The information on this page may come from third parties and does not represent the views or opinions of Gate. The content displayed on this page is for reference only and does not constitute any financial, investment, or legal advice. Gate does not guarantee the accuracy or completeness of the information and shall not be liable for any losses arising from the use of this information. Virtual asset investments carry high risks and are subject to significant price volatility. You may lose all of your invested principal. Please fully understand the relevant risks and make prudent decisions based on your own financial situation and risk tolerance. For details, please refer to
Disclaimer.
Related Articles
A whale-led selloff is driving the Bitcoin market, and ETF institutional buy pressure is unable to turn the tide
A CryptoQuant report indicates that as of the end of March, Bitcoin’s “apparent demand” is -63,000 BTC, showing that the market has an oversupply situation, and institutional buying cannot offset retail selling. Starting in mid-2025, the giant whales began large-scale selling, pushing the market into a distribution phase. Although ETF institutional buying has increased, it has not been able to change the weak demand situation, and weakening domestic U.S. demand may further affect the market. Easing geopolitical tensions could become a catalyst for a short-term rebound.
MarketWhisper2m ago
BTC 15-minute drop of 0.73%: Technical support fails and on-chain congestion converges to suppress the rebound
From 2026-04-02 02:00 to 2026-04-02 02:15 (UTC), the BTC price fluctuated within the 66,858.6 - 67,355.0 USDT range. Over the 15 minutes, the return was -0.73%, and the amplitude reached 0.74%. During this period, market attention increased, short-term volatility intensified, and investors’ sentiment clearly shifted toward caution.
The main driving force behind this abnormal move was that the key technical support level of $66,700 was broken, along with the RSI falling below 30, indicating that short-term momentum weakened rapidly and investors’ willingness to sell increased. Additionally, the market sentiment became more cautious, and trading volume showed signs of decline.
GateNews3m ago
The “crypto pullback” wave on April 1: Is it a joke or a warning sign from within the market?
On April 1, at least five influential figures in the cryptocurrency space simultaneously posted farewell messages, declaring that they were leaving the industry permanently.
The posts quickly spread across X, creating a wave of confusion as the community couldn’t clearly tell where the serious statements ended.
TapChiBitcoin18m ago
Bitcoin, stocks soar as markets respond to chance of US and Israel-Iran war ending
Bitcoin (BTC) briefly jumped to $68,589, and US stock markets rallied as investors reacted to US President Donald Trump's statements on considering options for ending the US and Israel-Iran war. Separate, unconfirmed comments attributed to Iranian President Masoud Pezeshkian also suggested that Iran
Cointelegraph46m ago
Gate Daily Report (April 2): The U.S. Department of the Treasury releases a notice of proposed rules for the “GENIUS Act”; the CFTC says it is prepared to regulate the entire crypto market
Bitcoin (BTC) dipped in the short term to $67,600. The U.S. Department of the Treasury launched a small consultation on regulatory guidance for stablecoins under the “GENIUS Act,” and the CFTC Chair said he is ready to regulate the entire crypto market. Amid market developments, spot Bitcoin inflows are slightly higher than outflows, and the CFTC and the SEC have signed an agreement to coordinate digital asset regulation.
MarketWhisper51m ago
BTC 15-minute drop of 0.67%: leverage exits layered with short-side dominance sparked a short-term pullback
From 2026-04-02 01:00 to 01:15 (UTC), the BTC return rate recorded -0.67%. The K-line data range was 67,639.7 to 68,595.1 USDT, with a range of 1.39%. During this period, market attention increased, volatility noticeably intensified, and investors’ trading behavior became more short-term.
The main drivers of this unusual move were the concentrated withdrawal of leverage capital in the derivatives market and bearish sentiment taking the lead. Futures open interest fell by about $200 million in just 15 minutes, reflecting a faster release of leverage-related risk. At the same time, the funding rate turned negative, indicating that the bears had gained dominance.
GateNews1h ago
