BONK experienced a remarkable growth this week, with a price increase of approximately 46% over the past seven days—outperforming most other meme coins. However, price volatility has not fully reflected what is happening. Upon deeper analysis, it can be observed that the number of new users has surged, large wallets have been accumulating early, and the price structure still has room to continue upward. Nevertheless, the upward momentum may temporarily pause before continuing.
The key point is not the continuous daily price increase, but whether buying pressure can sustain after the initial breakout.
BONK User Activity Surges Alongside Price
An important indicator is the number of active addresses. This metric shows the number of unique wallets conducting BONK transactions each day. When this number increases, it usually indicates that more people are actively using or holding the token, rather than just engaging in short-term trading.
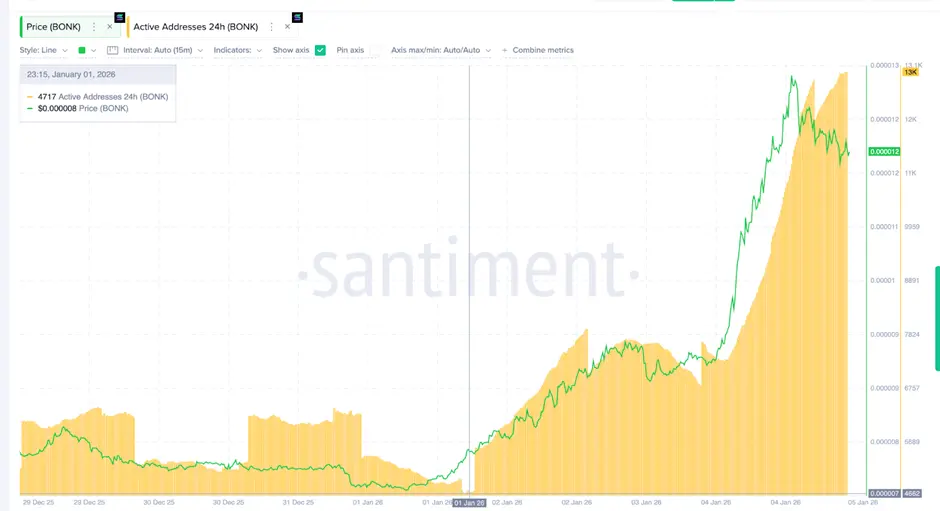 Active Addresses | Source: SantimentIn early January, BONK recorded around 4,700 active addresses. By January 5th, this number nearly tripled to nearly 13,000 addresses. This is an impressive growth in a short period.
The significance of this lies in the fact that many meme coin price rallies often fail when they only attract short-term traders. When wallet activity increases significantly like now, it indicates genuine and broader interest. Even if BONK’s price temporarily stalls, the increase in activity still supports a positive trend.
As of now, BONK’s usage has grown in tandem with its price, indicating a solid foundation for an upward trend.
Large Wallets Early Accumulation, Then Pausing
Another factor to observe is the behavior of “whales”—wallets holding large amounts of tokens. For BONK, this group includes wallets holding from 100 million BONK to 1 billion BONK.
Since December 31st, the total BONK held by these wallets increased from approximately 2.7227 trillion BONK to 2.7321 trillion BONK, adding about 9.41 billion BONK during the initial phase of the rally.
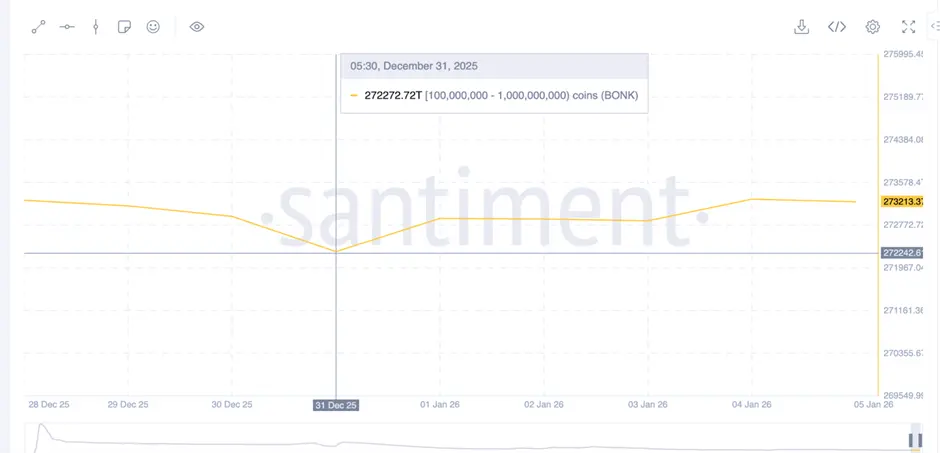 BONK Whales | Source: SantimentAfterward, the holdings of large wallets remained almost unchanged. This does not mean they sold, but simply that they stopped buying at higher prices.
This is a common strategy among large investors: buy early when prices are low, then observe as the market heats up. They often wait for stability before making their next move.
Currently, there are no clear signs of these large wallets divesting. They continue to hold the BONK they accumulated earlier.
BONK Price Structure Still Shows Growth Potential
The BONK price chart shows a strong rally followed by sideways movement, reflecting a pause among buyers after a breakout.
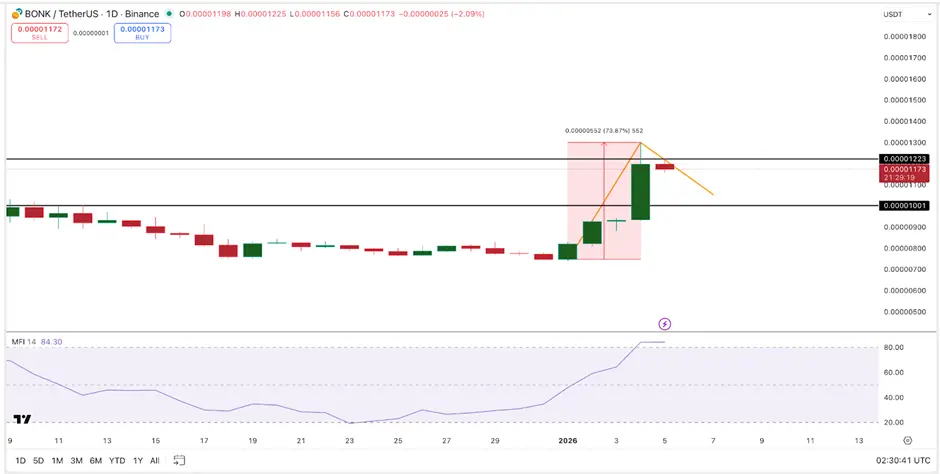 BONK Price Action | Source: TradingView As long as BONK stays above the $0.000010 level, this price structure remains intact. If the price breaks above $0.000012, it would signal that buying pressure continues to dominate. Conversely, if the price drops below $0.000010, the upward trend could reverse.
In terms of potential, the previous rally allows for an estimated growth of up to approximately 74%, if BONK continues its upward trend in the near future.
However, the (MFI) money flow index also indicates a possible correction. This index has entered overbought territory and has been sideways recently, signaling expectations of a price correction that could attract more buying interest at lower levels.
Some meme coin market analysts also point out an important confirmation threshold: if BONK surpasses $0.00001687, the next bullish trend could be triggered. Before reaching this level, minor corrections or sideways oscillations are considered normal.
For short-term support, the $0.00001069 zone is crucial and aligns with the TCR price chart. If BONK approaches this zone without dropping further, it is still viewed as a positive development after a strong rally.
Disclaimer: The information on this page may come from third parties and does not represent the views or opinions of Gate. The content displayed on this page is for reference only and does not constitute any financial, investment, or legal advice. Gate does not guarantee the accuracy or completeness of the information and shall not be liable for any losses arising from the use of this information. Virtual asset investments carry high risks and are subject to significant price volatility. You may lose all of your invested principal. Please fully understand the relevant risks and make prudent decisions based on your own financial situation and risk tolerance. For details, please refer to
Disclaimer.
Related Articles
Cardano’s Treasury Spent Millions While ADA Price Sinks – Community Demands Answers!
Cardano's recent drop to 13th place on CoinMarketCap has frustrated long-time holders, as the project struggles to recover its market cap. Community member Bobcorn criticizes treasury spending, arguing it benefits developers while investors suffer losses. The divide persists, with some supporting infrastructure investments for future growth, while others see them as wasteful during poor performance.
CaptainAltcoin5m ago
Bitcoin Faces Extended Weakness Below Key Cost Basis
Bitcoin struggles below the $72.5K realized price, indicating resistance and prolonged bearish sentiment. Repeated rejections at $71K and a drop to $66K demonstrate strong selling pressure. Indicators suggest fragile recovery, with risks of further declines if support fails.
CryptoFrontNews19m ago
The cryptocurrency market's trading volume has dropped back to the levels of the 2022 bear market, with ETH's trading volume decreasing more than BTC's, and Gas fees hitting an all-time low.
The average weekly trading volume in the cryptocurrency market has fallen to $90 billion, a decrease of 7% from the mean, indicating that activity has dropped to levels seen during the bear market of 2022; Ethereum gas fees have fallen to historic lows, reflecting a contraction in on-chain activity. Both Bitcoin and Ethereum trading volumes are below the average, with funding rates recovering but still at low levels. The market is currently in a quiet state, lacking clear catalysts.
動區BlockTempo30m ago
RAIN Crypto Price Dips: Will the $10M Sell-Off Halt Recovery?
RAIN drops over 17% after $10M sell-off despite institutional support.
RAIN trades below key $0.0082 support, raising concerns about market cap decline.
Whale activity and green candles suggest potential rebound if momentum sustains.
Rain Protocol — RAIN, has seen a sharp decline,
CryptoNewsLand44m ago
‘Extreme Fear’ Is Back but Bitcoin’s Price Recovery Depends on it: Santiment
Bitcoin dipped to a four-week low on Friday at $65,500 after it was rejected at $72,000 a few days earlier, which pushed the overall market sentiment back to ‘extreme fear’ territory.
However, the analysts from Santiment believe this could be the precise push BTC needs to stage a notable
CryptoPotato1h ago
XRP Price Analysis: A whale continues to buy, and $1.30 is a key support level
As of the end of March 2026, the price of XRP fluctuates around $1.32, facing key support. The weekly RSI is close to oversold, indicating a potential rebound. If it falls below $1.30, the support levels are at $1.24 and $1.20. Whales continue to accumulate, showing long-term accumulation intent, but on-chain activity is declining, and market liquidity is insufficient.
GateNews1h ago
