Over the past week, the price of Cardano (ADA) has increased by nearly 21%, and in the last 24 hours alone, it has risen by about 7%, making it one of the major coins with the most positive developments. This upward momentum was initially considered quite sustainable, as technical signals on the chart indicated an improving trend.
However, upon deeper analysis, the market picture becomes more complex. Although the overall trend still leans towards growth, momentum indicators suggest that the strength of the trend is gradually weakening. Instead of a sharp correction, current data indicate a high likelihood that ADA will enter a sideways accumulation phase before establishing its next direction. Below are detailed analyses of the market signals.
Uptrend maintained, but momentum decreasing on the 12-hour chart
On the 12-hour timeframe, ADA still maintains an uptrend structure. A notable positive signal is the upcoming crossover between the exponential moving averages (EMA), as the 20-period EMA approaches the 50-period EMA. This crossover often signals that the medium-term trend is being reinforced.
However, momentum indicators show signs of stagnation. From December 9 to January 6, ADA’s price was trending downward while the (RSI) increased. This is a hidden bearish divergence—often indicating weakening momentum, with potential short-term correction risks, rather than a trend reversal.
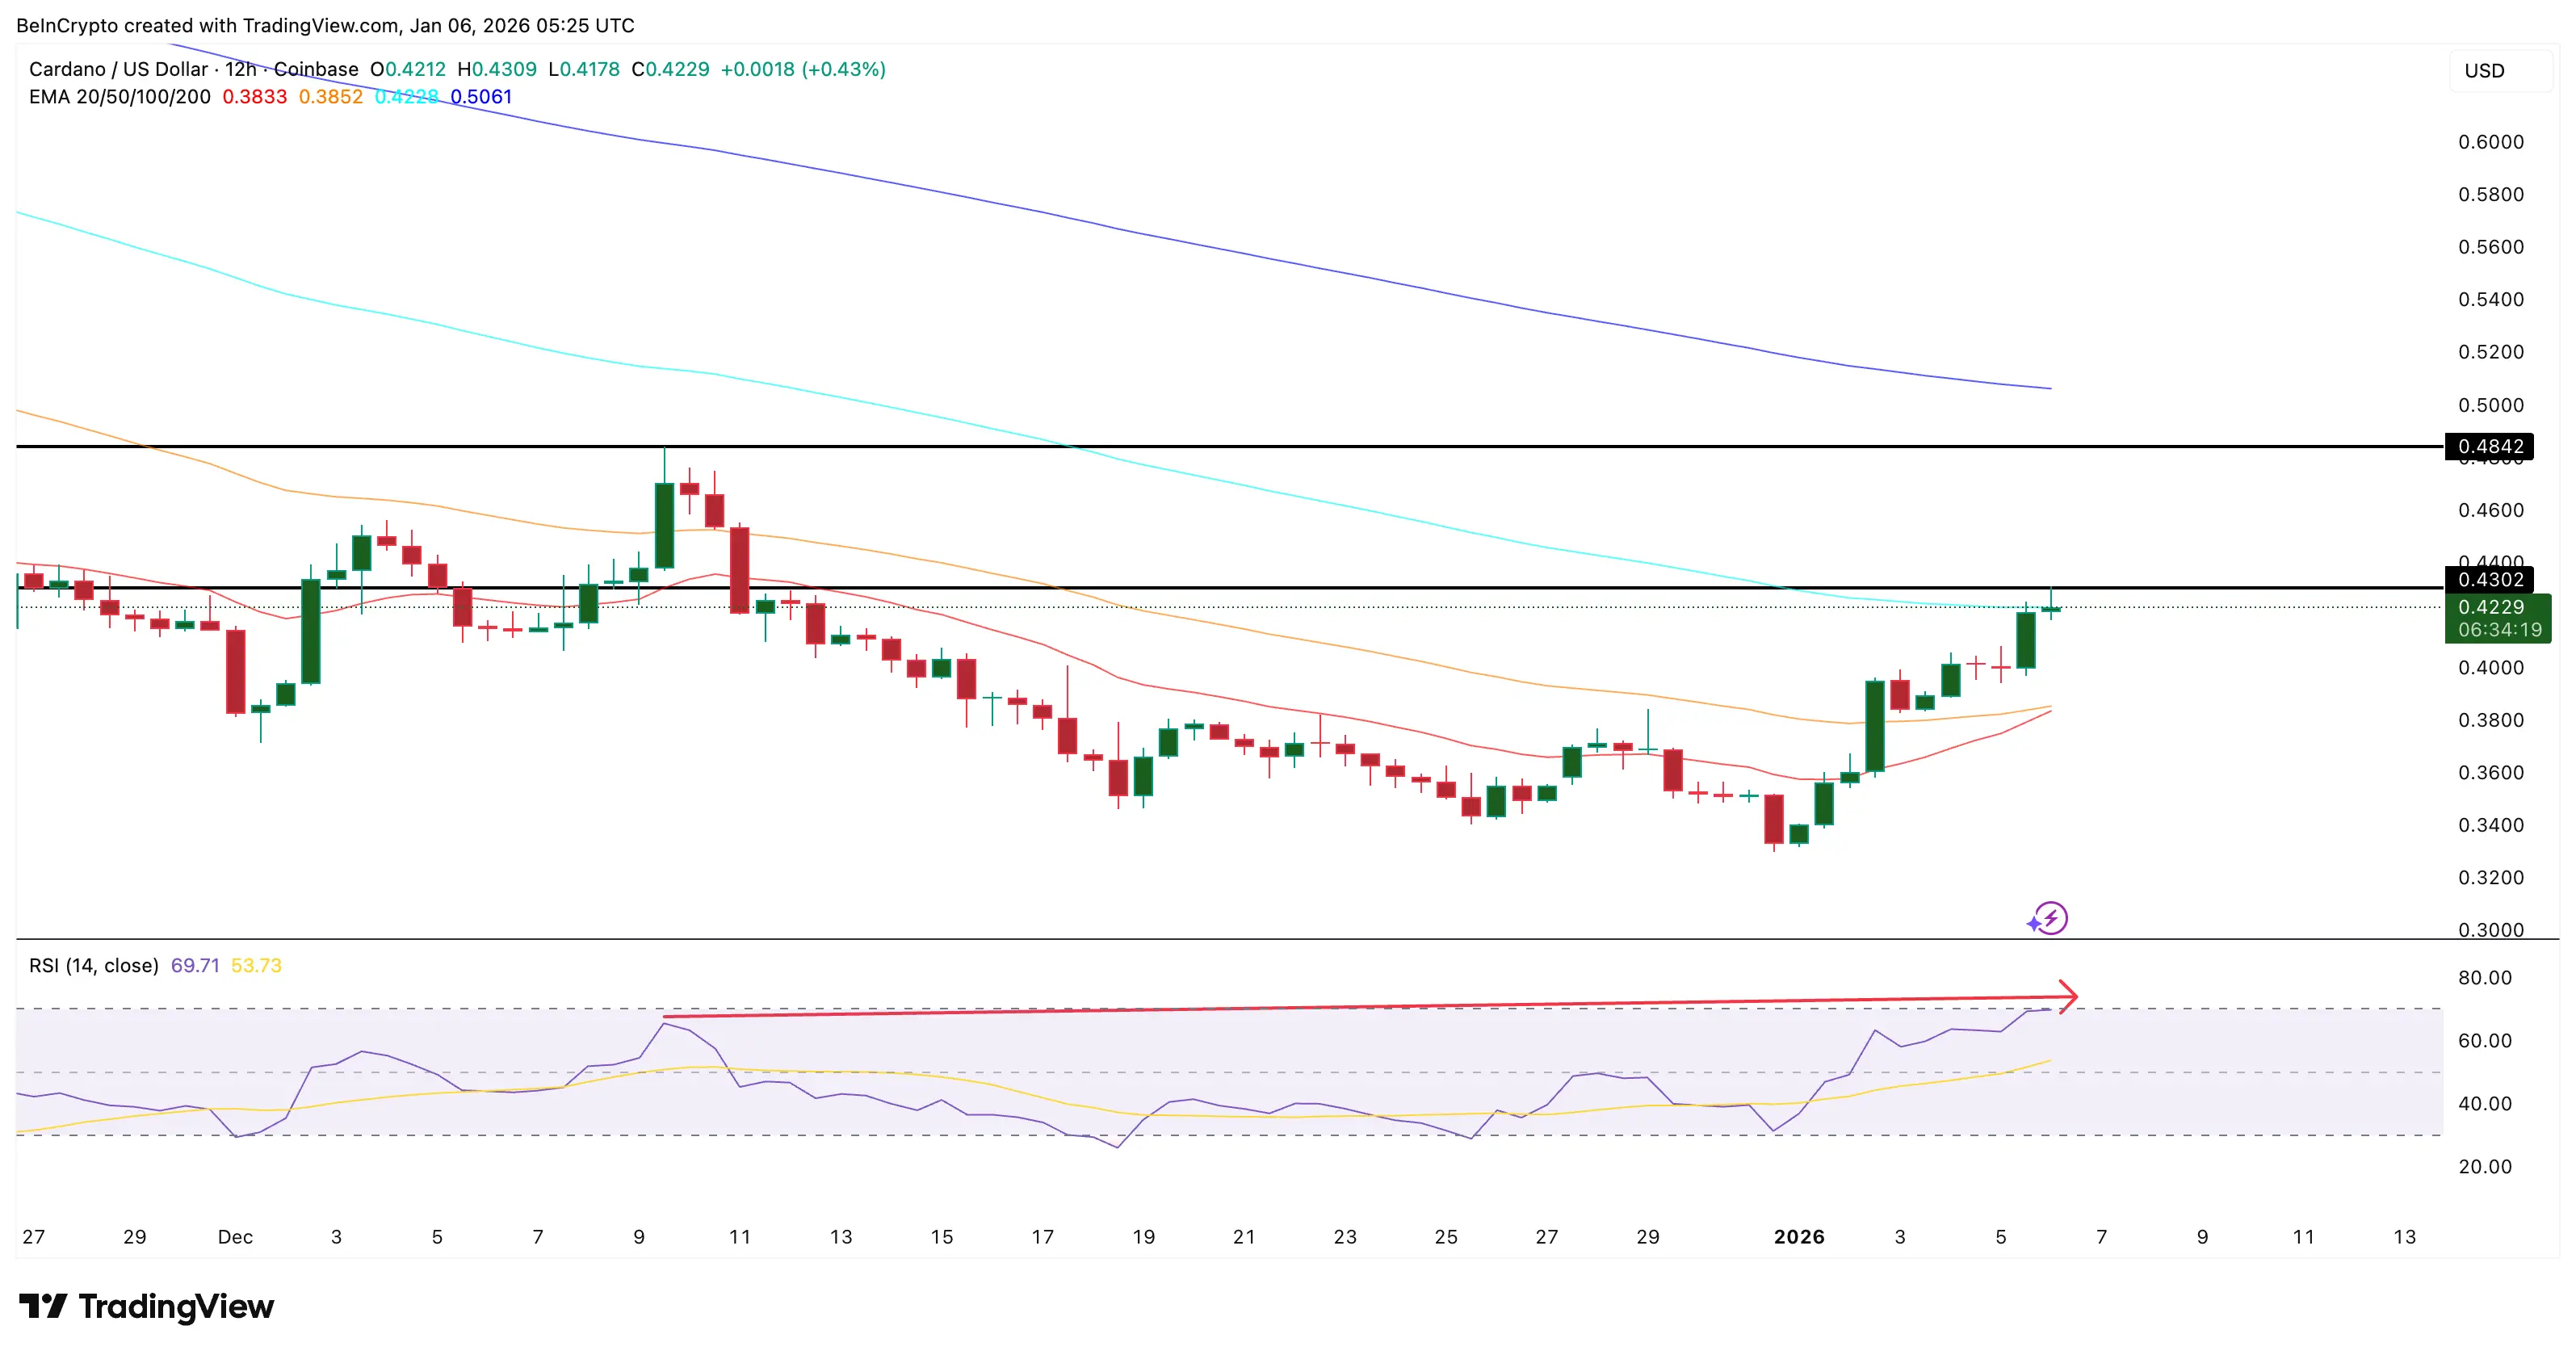 Conflicting indicators appear | Source: TradingView If the next candle of ADA forms below the $0.43 level, a lower high pattern will be confirmed, increasing the risk of correction.
In summary, the uptrend still exists, but the driving force has weakened. This combination often leads to an accumulation phase, moving sideways rather than continuing a strong rise or a sharp decline.
On-chain data: Patient investors, no signs of panic
On-chain indicators suggest the likelihood of a deep correction is quite low at this time.
The Spent Coins Age Bands index tracks the amount of ADA moved by investor groups with different holding periods. When this value decreases, it indicates that investors are holding onto their coins rather than selling.
The two most prominent groups are:
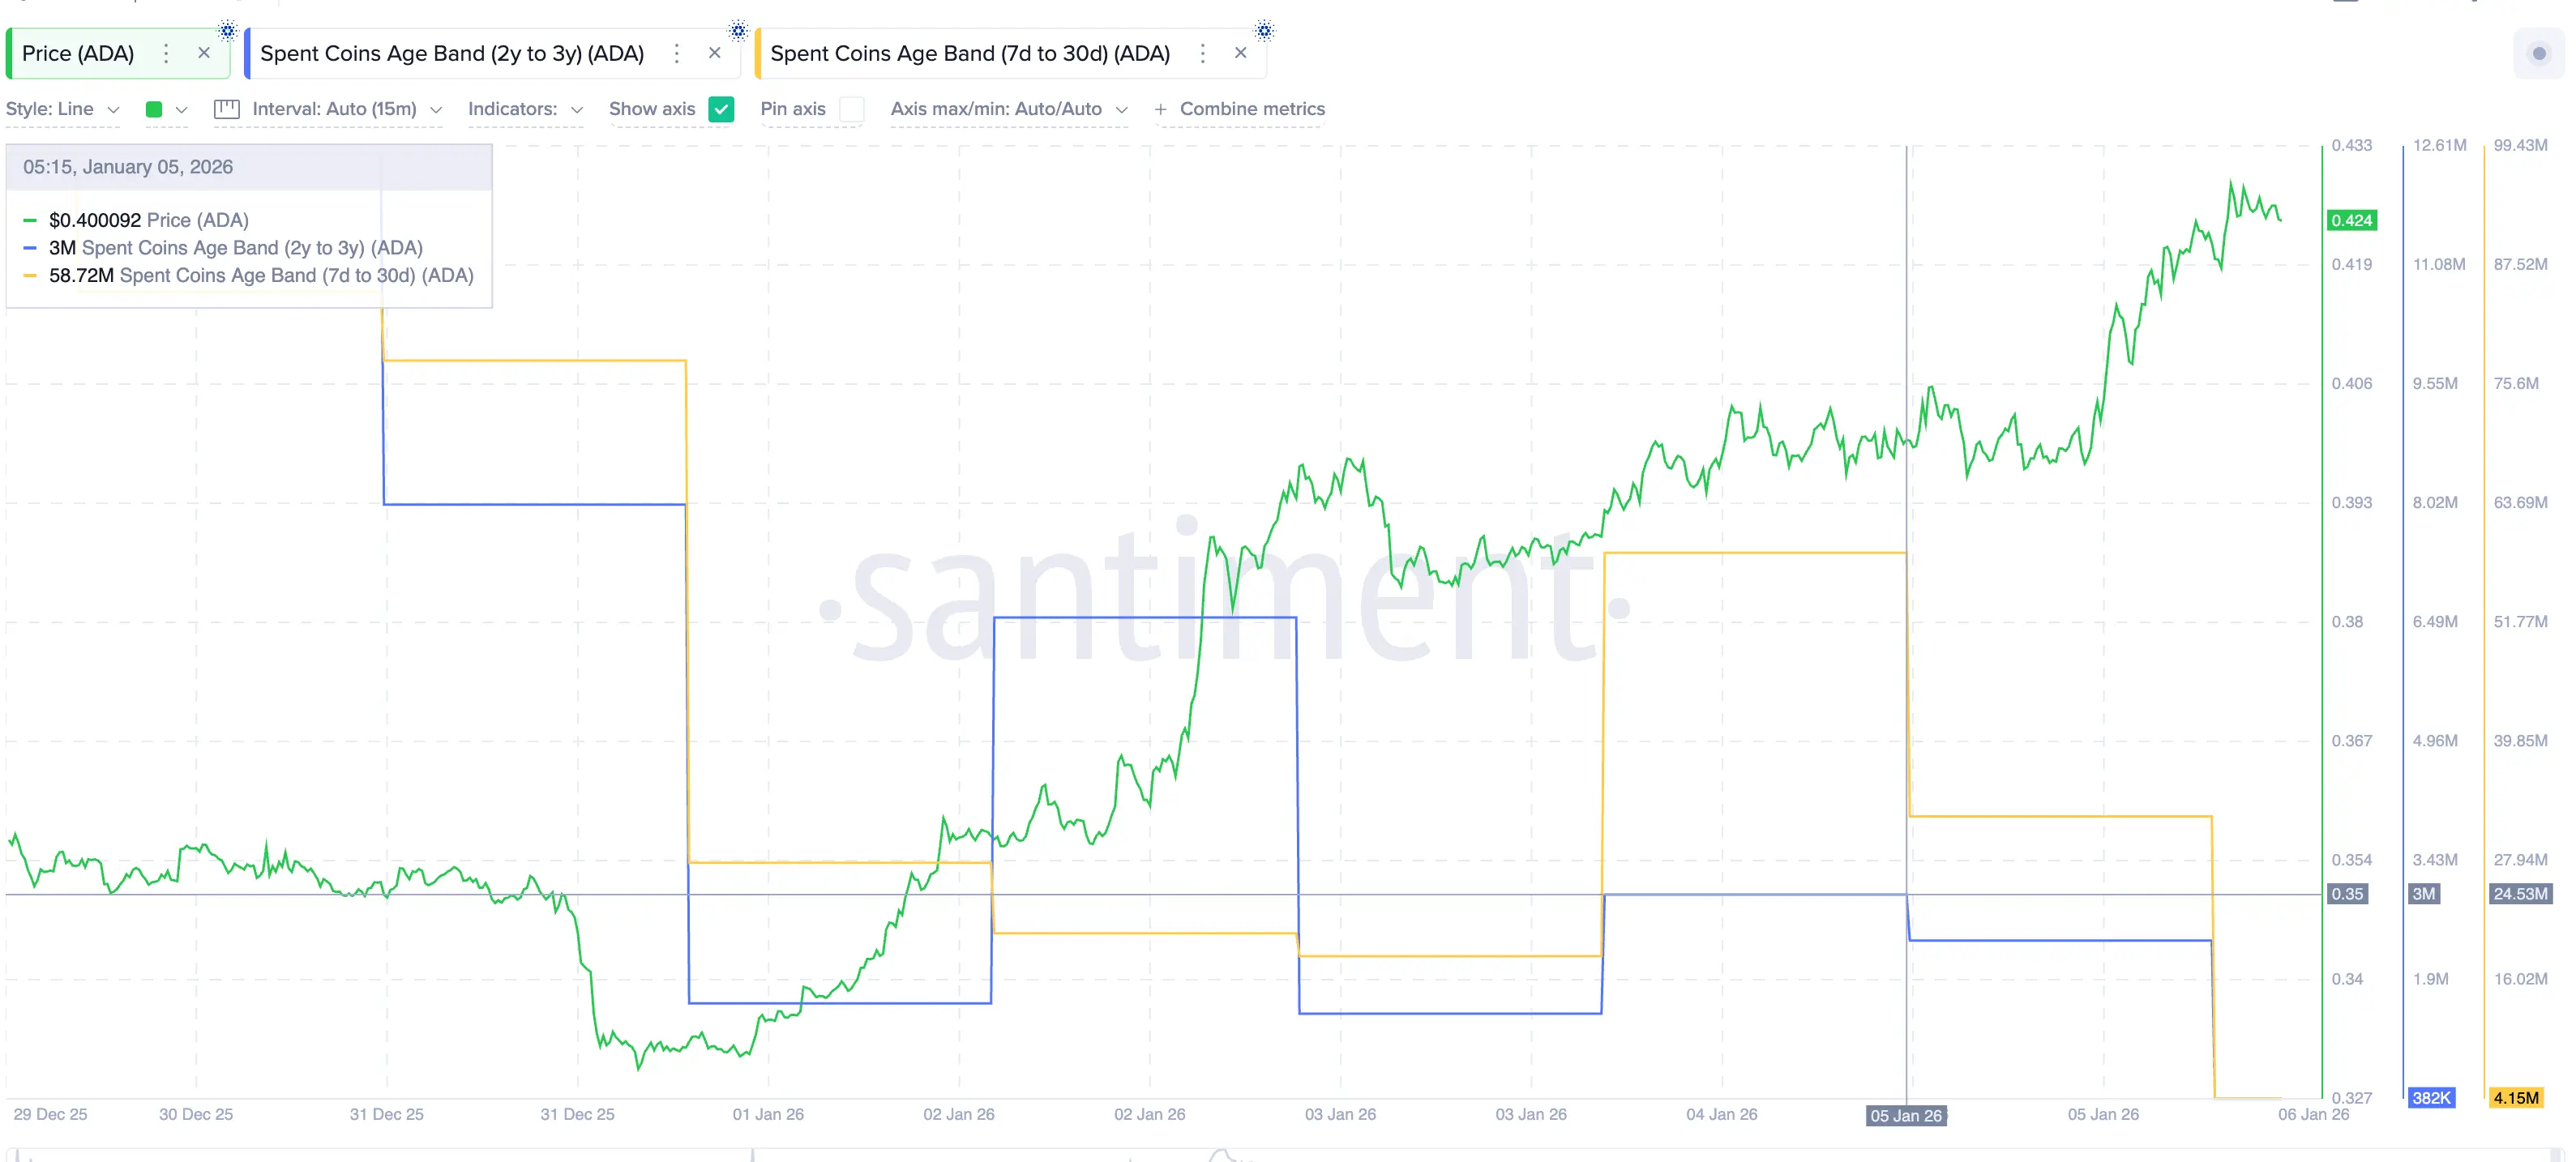 Slow transaction activity of ADA coins | Source: Santiment This shows that both short-term and long-term investors are choosing patience, with no signs of panic selling or strong profit-taking, even after the recent impressive rally.
When market momentum decreases but capital flow remains low, the market typically shifts into an accumulation state, trading within a narrow range rather than experiencing sharp declines.
Important ADA price levels: Trading range of 9%
In the context of weakening trend strength and momentum, price levels become particularly significant.
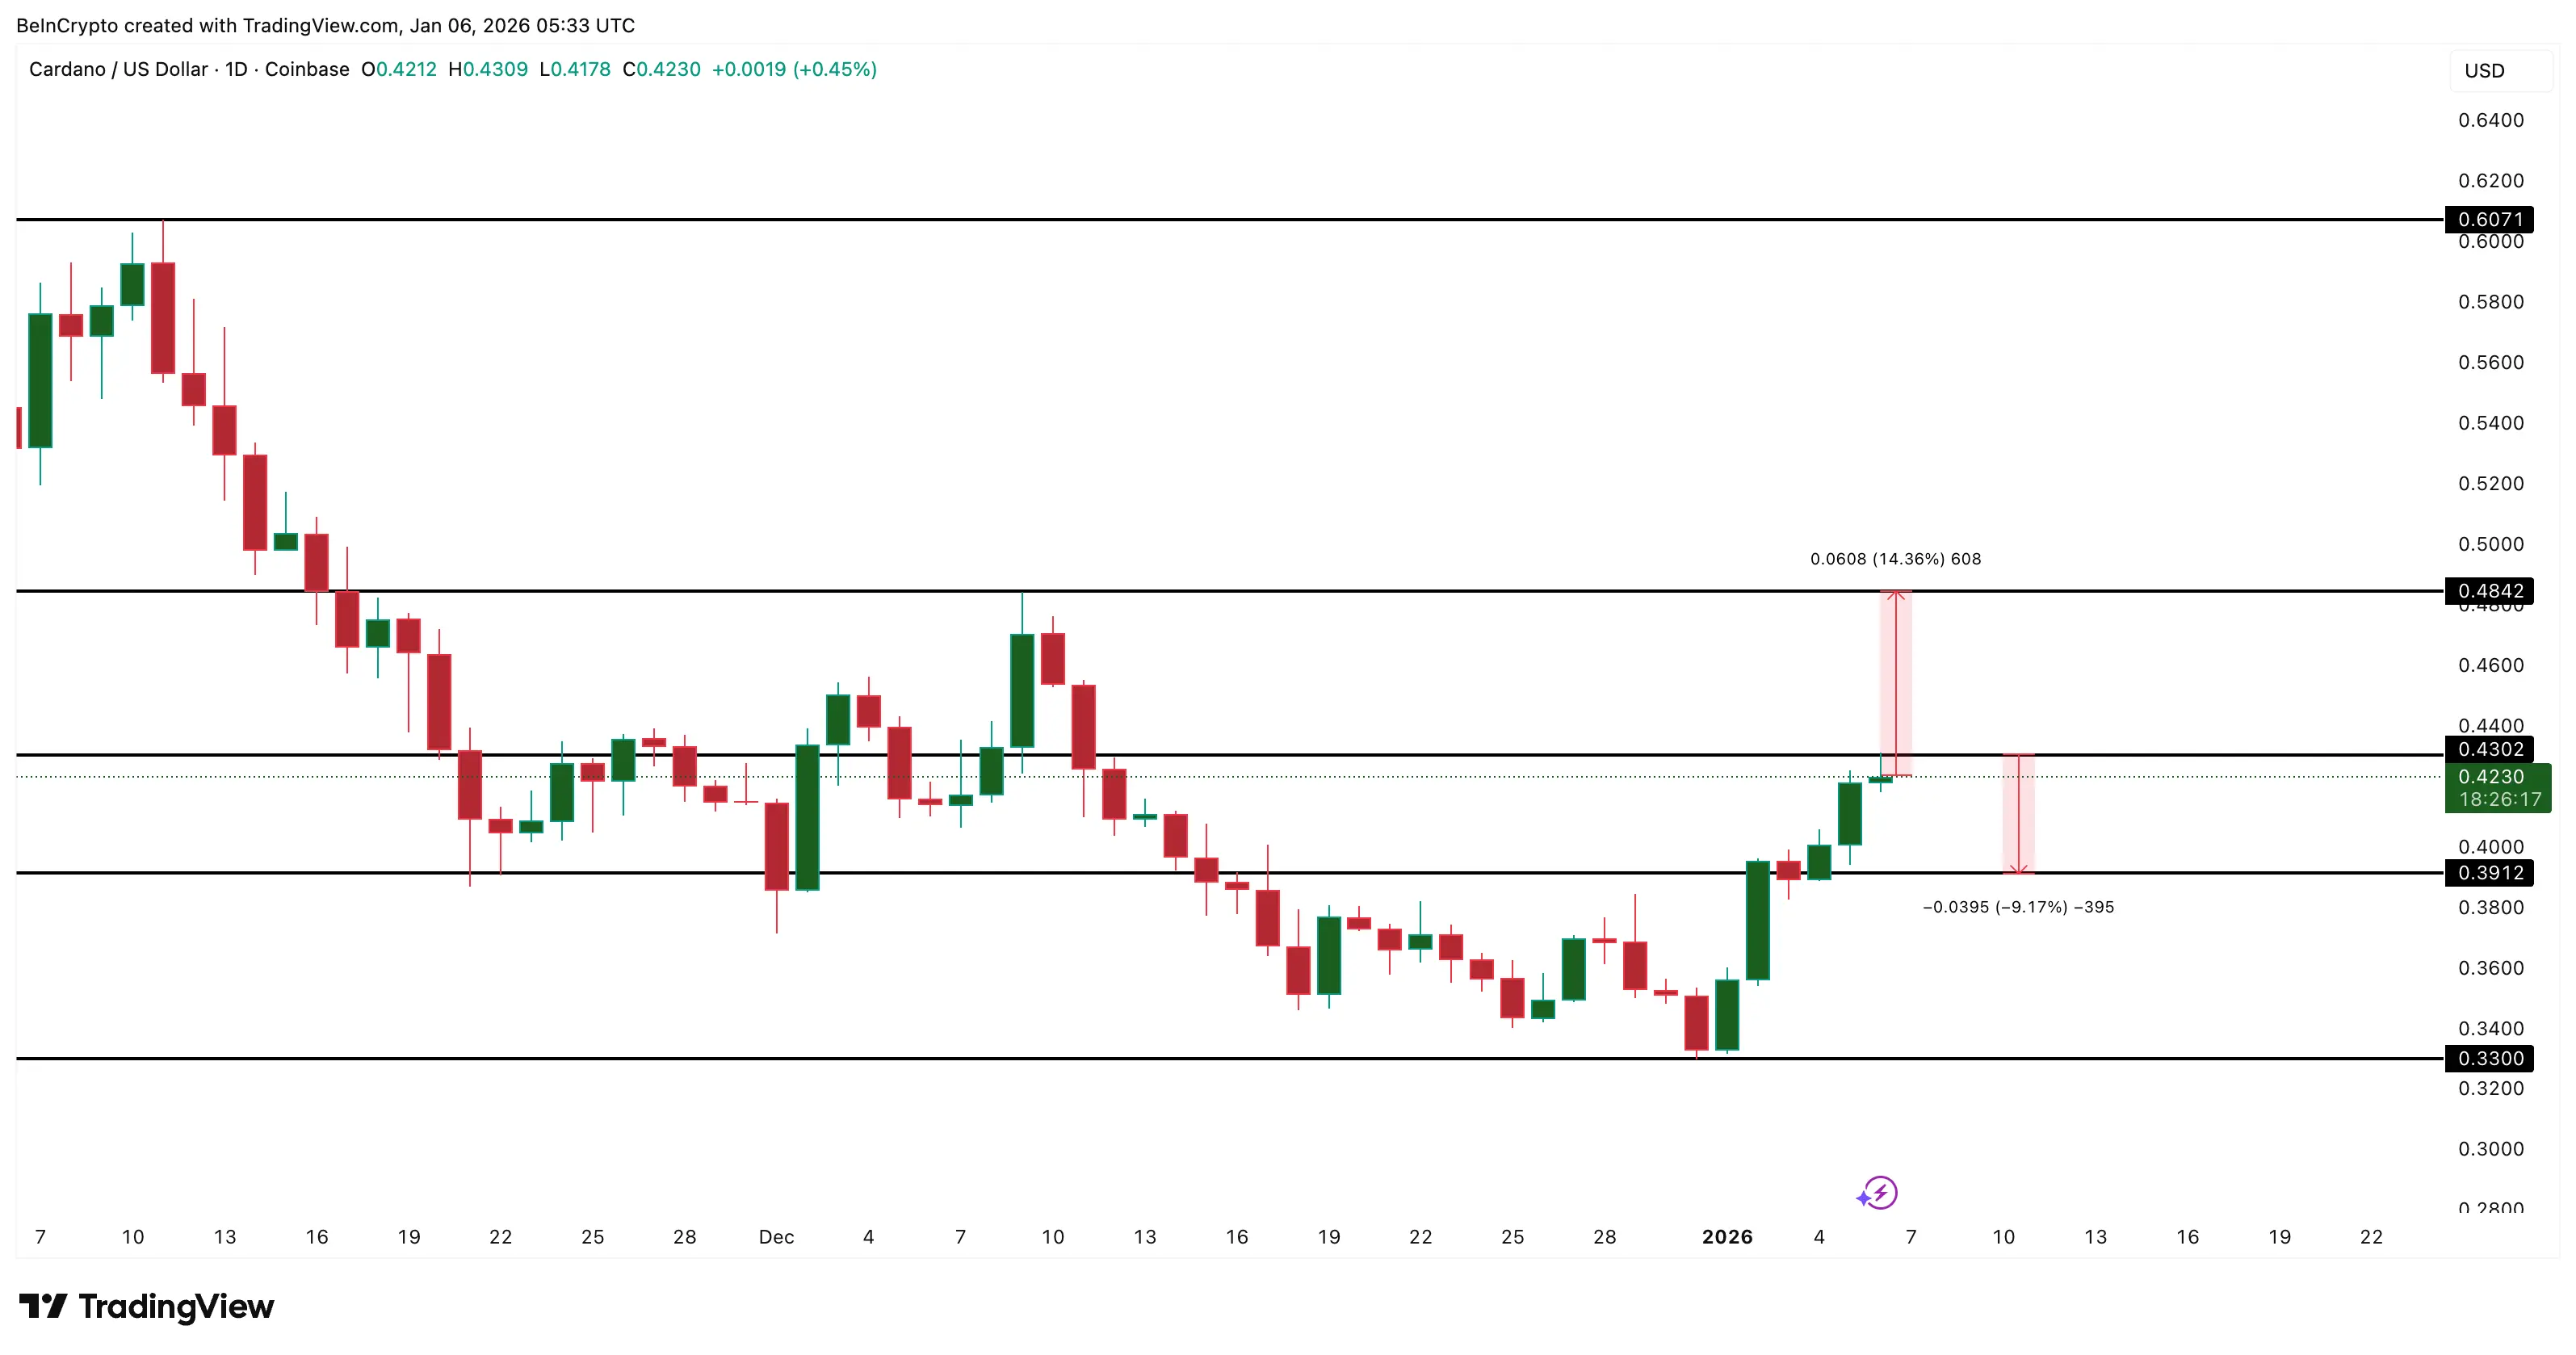 ADA price analysis | Source: TradingView Until one of these levels is broken, the most likely scenario is that ADA will trade within the range of $0.39 to $0.43, corresponding to about a 9% fluctuation.
This range accurately reflects the current market dynamics: the uptrend still exists, patient investors have not sold, but momentum needs time to reset before the next major move.
Disclaimer: The information on this page may come from third parties and does not represent the views or opinions of Gate. The content displayed on this page is for reference only and does not constitute any financial, investment, or legal advice. Gate does not guarantee the accuracy or completeness of the information and shall not be liable for any losses arising from the use of this information. Virtual asset investments carry high risks and are subject to significant price volatility. You may lose all of your invested principal. Please fully understand the relevant risks and make prudent decisions based on your own financial situation and risk tolerance. For details, please refer to
Disclaimer.
Related Articles
Bitcoin risks 50% drop as BTC’s positive correlation with US stocks grows
Bitcoin (BTC) erased much of its US-Iran war-driven gains this week, moving back in sync with the broader downtrend in risk assets, mainly US equities.
Key takeaways:
Bitcoin’s positive flip in S&P 500 correlation has historically preceded average declines of around 50% since 2018.
BTC
Cointelegraph15m ago
Impact of the Current US–Israel–Iran War on Cryptocurrency: Market Volatility, Bitcoin Trends & Future Outlook (2026)
🌍 Introduction
The ongoing geopolitical conflict involving the United States, Israel, and Iran has created shockwaves across global financial markets. From rising oil prices to falling stock indices, every asset class is being affected — including cryptocurrency.
In 2026, crypto is no
Cryptoknowmics20m ago
BTC Price Fluctuation Analysis
# BTC 2026-03-23 11:00–11:15(UTC)Price Anomaly Deep Attribution Report
## I. Executive Summary and Core Conclusions
During the time window of 2026-03-23 11:00–11:15(UTC), BTC price return was +3.51%, showing significant anomaly. This report systematically traces the causes of price anomaly through quantitative indicators including on-chain data, trading volume, position changes, and capital flows, combined with market structure and behavioral analysis. Conclusions show that this round of anomaly was primarily driven by institutional capital inflows (ETF net purchases), futures market leverage
GateNews29m ago
Crypto Market Declines As Fear Grips Investors
The crypto market is down, with a total market cap of $2.36T. Bitcoin and Ethereum have dipped by 0.82% and 2.47%, respectively. Nonetheless, some altcoins have surged significantly. DeFi TVL has decreased, while NFT sales volume has increased. Blockchain social apps are gaining traction amid geopolitical tensions.
BlockChainReporter41m ago
Solana Price Under Pressure, Can Institutional Buying Support Help SOL Return to $100?
Solana (SOL) has recently hovered around $86-87, declining nearly 7% over the past week, related to overall crypto market weakness. Clear classification of crypto assets by U.S. regulators benefits institutional investors. Capital flows show robust institutional demand, with continuous net inflows into Solana ETFs. Technical analysis shows SOL below the $90 resistance level, with support at $85. Investors should monitor institutional dynamics and technical indicators to gauge short-term trends.
GateNews1h ago
Bitcoin MACD Reignites Red Alert, Bulls May Face Risk of Sharp Drop
Bitcoin bulls should be alert to the sell signal indicated by the MACD indicator. Recent weakening momentum may cause a price correction. Historical patterns show that whenever the MACD drops below the zero line, prices tend to fall sharply. Given the tense geopolitical situation, traders should monitor technical indicator changes, manage risks appropriately, and operate cautiously.
GateNews1h ago
