
Date: Thu, Jan 01, 2026 | 10:30 AM GMT
As the new year 2026 begins, the broader cryptocurrency market is showing modest weakness, with both Bitcoin (BTC) and Ethereum (ETH) trading slightly in the red. This soft start has weighed on sentiment across the altcoin space as well, including Monad (MON). However, beneath the surface, MON’s chart structure is beginning to tell a more constructive story.
MON is currently down around 4% on the day, extending its 60-day decline to roughly 21%. While short-term price action remains subdued, the more important signal is emerging on the daily chart, where price structure is beginning to hint at a meaningful shift. If confirmed, this setup could mark the early stages of a bullish continuation following a prolonged corrective phase.
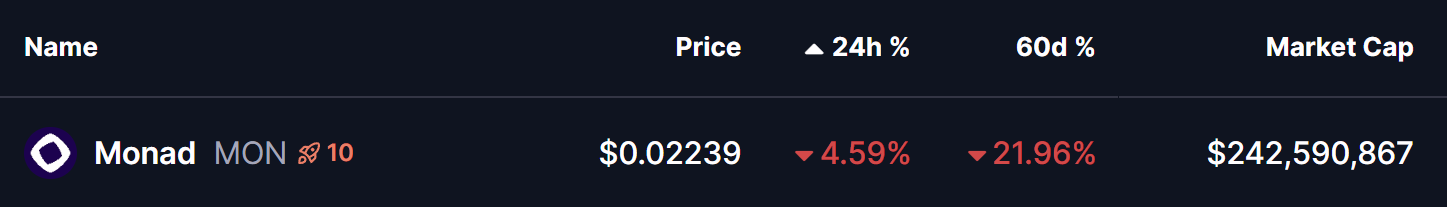
Source: Coinmarketcap
Rounding Bottom in Play
On the daily timeframe, MON appears to be forming a textbook rounding bottom pattern — a classic bullish reversal structure that typically develops after extended downside pressure. This pattern reflects a gradual transition from distribution to accumulation, where selling momentum weakens and buyers begin to step in more consistently.
Previously, MON faced strong rejection near the $0.04923 neckline zone, triggering a sharp decline that unfolded through late November and December. That move eventually found a floor near the $0.017 level, which has since acted as a key demand zone. Repeated defenses of this area prevented any deeper breakdown and helped establish a stable base for a potential trend reversal.
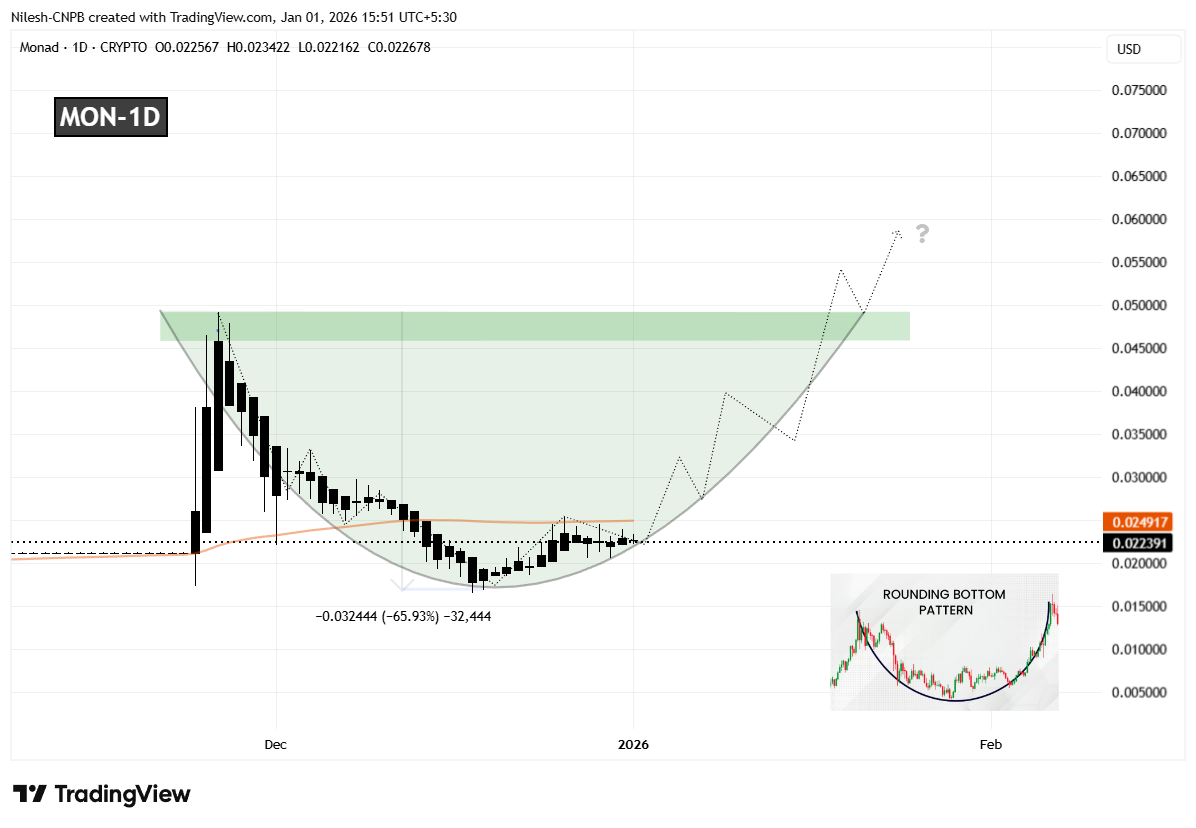
Monad (MON) Daily Chart/Coinsprobe (Source: Tradingview)
Since forming that bottom, MON has started to curve higher in a rounded fashion, closely matching the classic structure of a developing bottoming pattern. This gradual recovery suggests that selling pressure is fading rather than accelerating. The recent stabilization and recovery back above the $0.022 region further indicate that accumulation may be taking place as the market quietly prepares for a larger move.
What’s Next for MON?
For the rounding bottom pattern to move into confirmation, MON needs to reclaim the 50-day moving average, currently positioned near the $0.02491 level. A sustained move above this area would signal a shift in short-term momentum and confirm that buyers are beginning to regain control after months of corrective price action.
Looking ahead, the most significant technical hurdle remains the neckline resistance around $0.04923. A clean and decisive breakout above this zone would validate the entire reversal structure and could open the door for a broader bullish expansion phase, with momentum traders likely returning to the market.
Until those levels are reclaimed, the pattern remains in its early development stage. Short-term pullbacks or consolidation remain possible if MON struggles near the 50-day moving average. However, as long as price continues to hold higher lows above the $0.017 base, the broader bottoming structure remains intact.
Overall, MON’s emerging rounding bottom formation suggests the token may be approaching an important inflection point. While confirmation is still pending, the improving structure and alignment with a classic bullish pattern indicate that the coming sessions could be decisive for Monad’s next directional move.
Disclaimer: The views and analysis presented in this article are for informational purposes only and reflect the author’s perspective, not financial advice. Technical patterns and indicators discussed are subject to market volatility and may or may not yield the anticipated results. Investors are advised to exercise caution, conduct independent research, and make decisions aligned with their individual risk tolerance.
About Author: Nilesh Hembade is the Founder and Lead Author of Coinsprobe, with over 5 years of experience in the cryptocurrency and blockchain industry. Since launching Coinsprobe in 2023, he has been providing daily, research-driven insights through in-depth market analysis, on-chain data, and technical research.
Disclaimer: The information on this page may come from third parties and does not represent the views or opinions of Gate. The content displayed on this page is for reference only and does not constitute any financial, investment, or legal advice. Gate does not guarantee the accuracy or completeness of the information and shall not be liable for any losses arising from the use of this information. Virtual asset investments carry high risks and are subject to significant price volatility. You may lose all of your invested principal. Please fully understand the relevant risks and make prudent decisions based on your own financial situation and risk tolerance. For details, please refer to
Disclaimer.
Related Articles
AI and Interoperability Lead the Charge – Analyzing Today’s Top Crypto Gainers
The crypto market is currently experiencing a strategic shift in that investor interest has moved from stagnant legacy crypto assets to those that exhibit high utility and technological barriers. According to the latest data from CoinMarketCap’s Gainers list, over the last 24 hours the two
BlockChainReporter14m ago
Bitcoin jolted modestly higher on Iran ceasefire report; oil tumbles 4%
The crypto market experienced a slight recovery following news of a potential one-month ceasefire in negotiations involving U.S. envoys. This led to a drop in oil prices and a brief rise in Bitcoin, with U.S. stock futures also gaining.
CoinDesk1h ago
BlackRock sees AI driving crypto’s next bull phase as altcoin interest fades
Robbie Mitchnick from BlackRock highlighted a shift in crypto investment focus, emphasizing AI's growing importance over new tokens. Investors are concentrating on established assets like Bitcoin and Ethereum, with AI seen as a key driver influencing crypto's future and potential as infrastructure.
CoinDesk2h ago
Shiba Inu Burn Rate Jumps 370% as SHIB Breaks Key Level
Key Insights:
The Shiba Inu burn rate surged over 370% in 24 hours, removing more than 4.2 million tokens and reducing the overall circulating supply significantly.
SHIB price climbed above a key resistance level while forming higher lows, indicating steady accumulation despite declining
CryptoNewsLand2h ago
Solana Reclaims $90 as Golden Cross Signals Renewed Momentum
Solana has surpassed the $90 resistance, aided by a golden cross indicating positive momentum, despite low trading volume. Strong on-chain growth supports price stability, and sustained support above $89.50 could push Solana towards $96, though higher volume is crucial for confirming a breakout.
CryptoNewsLand3h ago
Hyperliquid Gains Traction as ETF Push Meets Strong Momentum
Key Insights:
Grayscale ETF filing has increased institutional visibility for HYPEUSD, strengthening demand expectations as traditional investors seek simplified exposure to the Hyperliquid ecosystem.
Technical indicators show
CryptoNewsLand3h ago
