
Date: Wed, Dec 31, 2025 | 03:40 PM GMT
As the final hours of 2025 approach, the broader cryptocurrency market is showing modest strength. Both Bitcoin (BTC) and Ethereum (ETH) are trading slightly in the green, helping ease recent volatility and stabilize overall market sentiment. This calmer environment has allowed select altcoins — including Plasma (XPL) — to begin forming constructive technical setups after extended periods of downside pressure.
XPL is starting to attract attention with an impressive 11% daily jump, trimming its 60-day decline to roughly 43%. While the broader trend still reflects recovery mode, the more important signal is emerging on the daily chart, where price action is beginning to suggest a meaningful structural shift. If confirmed, this setup could mark the early stages of a bullish continuation heading into the new year.
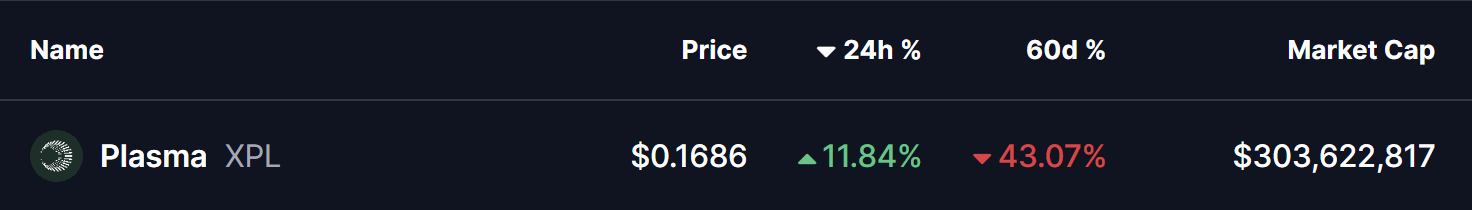
Source: Coinmarketcap
Rounding Bottom in Play
On the daily timeframe, XPL appears to be forming a textbook rounding bottom pattern — a classic bullish reversal structure that typically develops after a prolonged downtrend. This pattern reflects a slow but steady transition from selling dominance to accumulation, as bearish momentum fades and buyers gradually regain control.
Earlier in the trend, XPL faced strong rejection near the $0.3321 neckline zone, triggering a sharp decline that extended through November and December. That sell-off ultimately found a floor near the $0.1152 level, which has since proven to be a critical demand zone. Repeated defenses of this area prevented further downside and laid the foundation for a potential trend reversal.
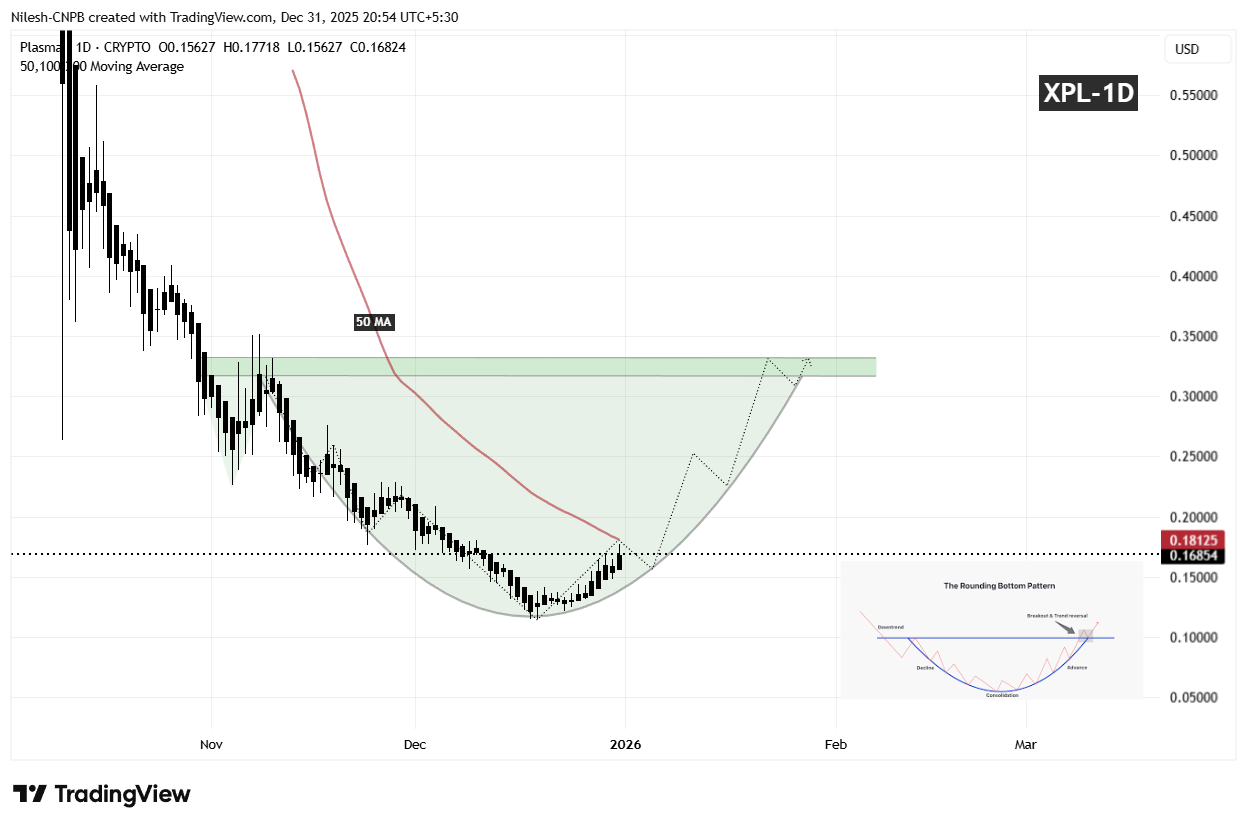
XPL Daily Chart/Coinsprobe (Source: Tradingview)
Since establishing that base, XPL has begun to curve higher in a rounded fashion, mirroring the classic structure of a developing bottom. This gradual recovery suggests that selling pressure is no longer aggressive, and that accumulation is taking place beneath the surface. The recent push back above the $0.16 region further reinforces the idea that buyers are positioning ahead of a larger directional move.
What’s Next for XPL?
For the rounding bottom pattern to gain confirmation, XPL needs to reclaim the 50-day moving average, currently positioned near the $0.1812 level. A sustained move above this area would signal a clear momentum shift and indicate that bulls are regaining control after months of corrective price action.
Looking higher, the most significant technical barrier remains the neckline resistance around $0.3321, highlighted by the prior distribution zone on the chart. A clean breakout above this region would validate the entire reversal structure and could open the door for a broader bullish expansion phase, with momentum traders and sidelined participants likely re-entering the market.
Until those levels are reclaimed, the pattern remains in its development phase. Short-term consolidation or minor pullbacks remain possible if price struggles near the 50-day moving average. However, as long as XPL continues to hold higher lows above the $0.1152 base, the broader bottoming structure remains intact.
Overall, XPL is approaching a technically important inflection point. The emerging rounding bottom formation, improving price structure, and proximity to key resistance levels suggest the coming sessions could prove decisive for Plasma’s next major directional move as the market transitions into 2026.
Disclaimer: The views and analysis presented in this article are for informational purposes only and reflect the author’s perspective, not financial advice. Technical patterns and indicators discussed are subject to market volatility and may or may not yield the anticipated results. Investors are advised to exercise caution, conduct independent research, and make decisions aligned with their individual risk tolerance.
About Author: Nilesh Hembade is the Founder and Lead Author of Coinsprobe, with over 5 years of experience in the cryptocurrency and blockchain industry. Since launching Coinsprobe in 2023, he has been providing daily, research-driven insights through in-depth market analysis, on-chain data, and technical research.
Disclaimer: The information on this page may come from third parties and does not represent the views or opinions of Gate. The content displayed on this page is for reference only and does not constitute any financial, investment, or legal advice. Gate does not guarantee the accuracy or completeness of the information and shall not be liable for any losses arising from the use of this information. Virtual asset investments carry high risks and are subject to significant price volatility. You may lose all of your invested principal. Please fully understand the relevant risks and make prudent decisions based on your own financial situation and risk tolerance. For details, please refer to
Disclaimer.
Related Articles
Retail buy orders fell from higher levels by 50%, and April presents an opportunity for a rebound in risk assets
In March, retail investors shifted toward stock sellers, and buy order volume fell nearly 50%. Despite bearish market sentiment, seasonal factors and ceasefire-related news may prompt the market to rebound in the second quarter, and investors should pay particular attention to the energy, technology, and crypto asset sectors.
GateNews6m ago
Ethereum rebounds to $2,257 as network stablecoin supply surpasses $180 billion, setting a new all-time high
Fueled by a ceasefire agreement between the United States and Iran, the price of Ethereum rose by about 9% on Wednesday, reaching a new high in several weeks. At the same time, stablecoin supply hit a historical high, suggesting increased activity across the Ethereum ecosystem. Analysts believe this provides solid support for Ethereum, and investors should watch macro events and changes in technical indicators.
GateNews7m ago
Bitcoin Reclaims Prices Above $70,000 at $72,000, Will it Reclaim $76,000 or Hit $60,000 Next?
Bitcoin reclaims prices above $70,000 at $72,000.
Will the price of BTC go bullish and surge above $76,000 next?
There is also a bearish possibility for BTC to drop to $60,000 next instead.
The crypto community is pleased to see the price of Bitcoin (BTC), the pioneer crypto asset, recla
CryptoNewsLand26m ago
Bitcoin breaks through $72,000; the ascending triangle pattern suggests a target of $80,000
Bitcoin’s price rose 6.7% on Wednesday to $72,379, influenced by easing tensions between the US and Iran and falling oil prices. Investor risk-avoidance sentiment eased, driving crypto and traditional assets to rise in tandem. Technical indicators show strong upward momentum for Bitcoin; if it breaks through $74,500, it could further test the $76,000 or $80,000 targets.
GateNews30m ago
6-week new high! Bitcoin ETF inflows of $470 million, analyst: a breakout move is brewing
U.S. spot Bitcoin ETFs pulled in $471 million on Monday, setting a six-week high and signaling a rebound in institutional investor confidence. Despite the strong inflows, geopolitical and economic uncertainties could still affect the rally. Analysts said that if broad economic variables improve, the crypto market may see upward momentum again.
CryptoCity32m ago
Crypto Market Rebounds With Notable Gains Across Leading Assets
The crypto market has seen a 23.11% increase in trading volume, with Bitcoin and Ethereum rising by 4.37% and 6.38%, respectively. Notable gainers include $CATX, $DOGO, and $PENGU, while DeFi and NFT sectors also grew significantly. Additionally, Morgan Stanley launched a BTC ETF, and FDIC proposed stablecoin regulation.
BlockChainReporter1h ago
