
Date: Fri, Jan 02, 2026 | 09:15 AM GMT
The broader cryptocurrency market has started the new year on a stable footing, with both Bitcoin (BTC) and Ethereum (ETH) trading slightly higher and posting gains of over 1.5%. This modest strength across major assets has provided breathing room for risk-on sentiment, allowing several memecoins to show early signs of recovery — including Popcat (SOL) (POPCAT).
POPCAT is currently trading by solid 19% higher on the day, but the more important development lies in its broader technical structure. After months of consistent downside pressure, the price action is now beginning to hint at a potential trend reversal, supported by a well-defined bullish pattern forming on the daily chart.
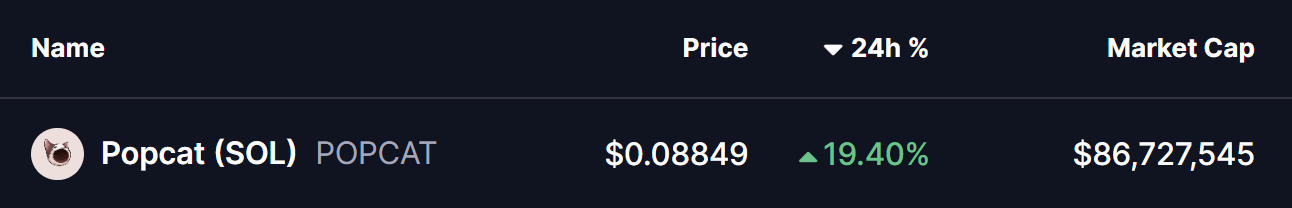
Source: Coinmarketcap
Falling Wedge Pattern in Play
On the daily timeframe, POPCAT appears to be carving out a falling wedge formation — a classic bullish reversal pattern that often develops after extended downtrends. This structure is characterized by lower highs and lower lows that gradually converge, reflecting weakening selling pressure and growing buyer interest near the lows.
Following weeks of steady decline, POPCAT recently established a local bottom near the $0.0725 region. This area acted as a strong demand zone, where buyers stepped in aggressively and prevented further downside. The resulting rebound pushed price back toward the $0.088 level, placing POPCAT just beneath the wedge’s upper resistance trendline.
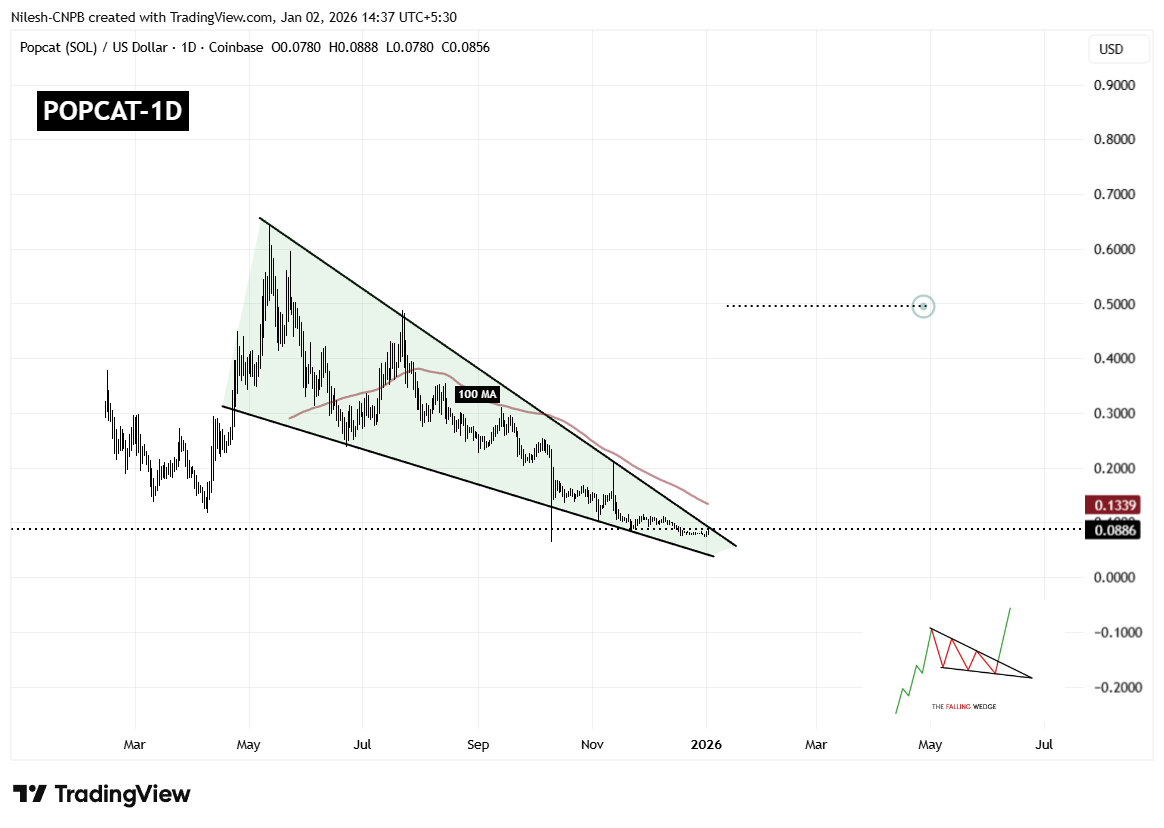
Popcat (POPCAT) Daily Chart/Coinsprobe (Source: Tradingview)
This compression near resistance is technically significant, as falling wedges tend to resolve with a sharp upside move once price breaks out of the structure. The longer price coils within the wedge, the stronger the eventual breakout tends to be.
However, overhead resistance remains notable. The 100-day moving average, currently hovering around $0.1339, represents a major technical barrier. This level has previously acted as dynamic resistance and will likely be a key area to watch if a breakout occurs.
What’s Next for POPCAT?
If buyers manage to push price decisively above the wedge resistance and reclaim the 100-day moving average with a strong daily close, POPCAT could confirm a bullish breakout. Such a move would mark a clear shift in trend structure and could open the door for a larger recovery rally.
Based on the measured move of the falling wedge pattern, the upside projection points toward the $0.49 region. Reaching this level would represent a substantial recovery from current prices and could attract renewed interest from momentum traders and sidelined participants.
That said, failure to break above resistance could result in continued consolidation. In a bearish scenario, POPCAT may revisit the $0.072 support zone once again. As long as this level continues to hold, the broader falling wedge structure would remain intact, keeping the bullish reversal thesis alive.
Overall, POPCAT is approaching a technically critical juncture. With price tightly compressed, selling pressure fading, and buyers defending key support levels, the coming sessions could prove decisive in determining whether this memecoin is ready to stage its next meaningful move higher.
Disclaimer: The views and analysis presented in this article are for informational purposes only and reflect the author’s perspective, not financial advice. Technical patterns and indicators discussed are subject to market volatility and may or may not yield the anticipated results. Investors are advised to exercise caution, conduct independent research, and make decisions aligned with their individual risk tolerance.
About Author: Nilesh Hembade is the Founder and Lead Author of Coinsprobe, with over 5 years of experience in the cryptocurrency and blockchain industry. Since launching Coinsprobe in 2023, he has been providing daily, research-driven insights through in-depth market analysis, on-chain data, and technical research.

Disclaimer: The information on this page may come from third parties and does not represent the views or opinions of Gate. The content displayed on this page is for reference only and does not constitute any financial, investment, or legal advice. Gate does not guarantee the accuracy or completeness of the information and shall not be liable for any losses arising from the use of this information. Virtual asset investments carry high risks and are subject to significant price volatility. You may lose all of your invested principal. Please fully understand the relevant risks and make prudent decisions based on your own financial situation and risk tolerance. For details, please refer to
Disclaimer.
Related Articles
Ethereum buy orders are coming back; $2,000 is the line between life and death—can the bulls kick off another round of upside?
In recent times, the Ethereum price has shown resilience. Its current trading price is around $2,237, and market analysis suggests it could enter a critical turning point. The derivatives market is active, with buying pressure leading; net trading volume has remained positive, which has caused institutional demand to pick back up. On the technical side, $2,000 is a key support level, and if it breaks above $2,400, it could move higher.
GateNews13m ago
Raoul Pal calls for ETH: based on the current trend, it has the potential to outperform BTC over the long term
Raoul Pal said the ETH/BTC exchange rate trend shows that ETH will outperform BTC as the business cycle and liquidity rebound. He emphasized that ETH, as a smart contract platform, will have a larger market size, while BTC mainly serves as a store of value. He predicted that Bitcoin will reach the peak of the bull market in the second quarter of 2026, and believes the current period is an extended five-year supercycle.
MarketWhisper38m ago
Is the Strait of Hormuz set to reopen soon? Bitcoin briefly surged 7%, with more than $400 million in short liquidations
Iran and the U.S. reach a two-week temporary ceasefire deal, with conditions requiring Iran to reopen the Strait of Hormuz. Bitcoin breaks through $72,000; liquidations of short positions in the derivatives market exceed $400 million, and positioning structures face a reset.
InstantTrends40m ago
XRP zooms 5% on bitcoin strength, but trend reversal still unconfirmed
XRP has broken above resistance at $1.37, indicating a potential tactical breakout, though the overall trend remains bearish. Key technical signals and strong volume suggest some accumulation, but market conviction is mixed. Traders should monitor price levels around $1.37 and aim for a significant test at $1.40-$1.42.
CoinDesk1h ago
The U.S., Israel, and Iran agree to a temporary ceasefire: oil prices plunge, and Bitcoin briefly breaks through $72k
Global geopolitical conditions have entered a major turning point at the very last moment, and the see-saw effect between safe-haven assets and risk assets has once again reached its peak. With less than an hour and a half remaining before the “final deadline” set by U.S. President Donald Trump, the situation has shifted dramatically.
InstantTrends4h ago
U.S.-Iran ceasefire drives Bitcoin higher—will this be a short-term rebound or the start of a new bull market?
Affected by the U.S.-Iran ceasefire agreement, the cryptocurrency market rebounded noticeably. Bitcoin briefly broke above $72,700, then fell back to around $71,695, with a gain of 4.3%. Analysts said this rally may be driven by short-term liquidity, while the long-term outlook remains uncertain; investors should watch changes in the macroeconomic environment and the situation in the Middle East.
GateNews4h ago
