Today, the Polkadot (DOT) price recorded an impressive increase of about 12% in just one day, surprising many traders. The main driver comes from the major upgrade on Kusama – a network closely linked to Polkadot. This event has contributed to improving short-term sentiment across the entire Polkadot ecosystem.
However, overall, the long-term trend remains unclear. DOT has still decreased approximately 53.5% over the past three months. A strong rally cannot erase the prolonged downtrend that preceded it.
Investors are now asking a big question: Is this the start of a new trend, or just a technical rebound in a weak market?
Kusama Upgrade Brings New Momentum to Polkadot Market Sentiment
The price increase of DOT is driven by Kusama – Polkadot’s testnet, where improvements are tested before official implementation. This week, Kusama deployed a notable upgrade, reducing block processing time to under 2 seconds and enhancing smart contract support. Transactions are faster, and expanded development tools attract more community interest.
Although this upgrade occurred on Kusama, not directly on Polkadot, the two networks are closely connected. Therefore, improvements on Kusama often influence market sentiment and DOT’s price.
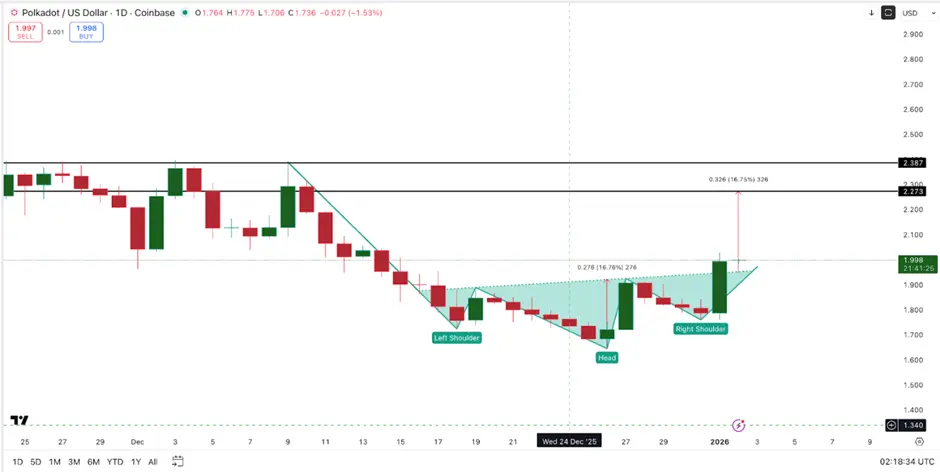 Polkadot DOT Price Surge | Source: TradingView Positive reactions from the cryptocurrency market to technical changes are common. An upgrade can create a “story” in the short term, attracting speculative capital and causing significant price volatility.
However, for a sustainable upward trend, real capital flow and demand must align. This remains a weak point in this rally.
DOT Chart Signals Breakout, but Buying Pressure Is Not Yet Strong Enough
From a technical analysis perspective, DOT recently broke the inverse head and shoulders pattern – often appearing at bottoms and signaling a potential trend reversal. If the rally continues, DOT could target the $2.27 level, representing an additional potential increase of about 13% from current levels. This is why DOT is back in the spotlight for many investors.
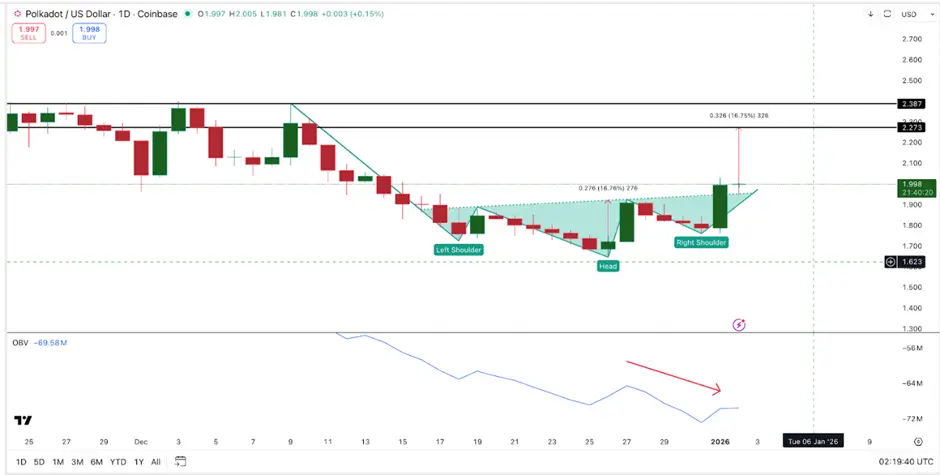 DOT Volume | Source: TradingView However, price patterns need to be confirmed by actual buying strength. The On-balance Volume (OBV) indicator – which tracks whether buyers or sellers control the trend – is still trending downward, indicating that trading volume has not fully aligned with the price. This often reflects uncertain market sentiment.
Similarly, the Chaikin Money Flow (CMF) indicator – measuring money flow into/out of the asset – remains below zero, suggesting large investors have not yet fully entered the market.
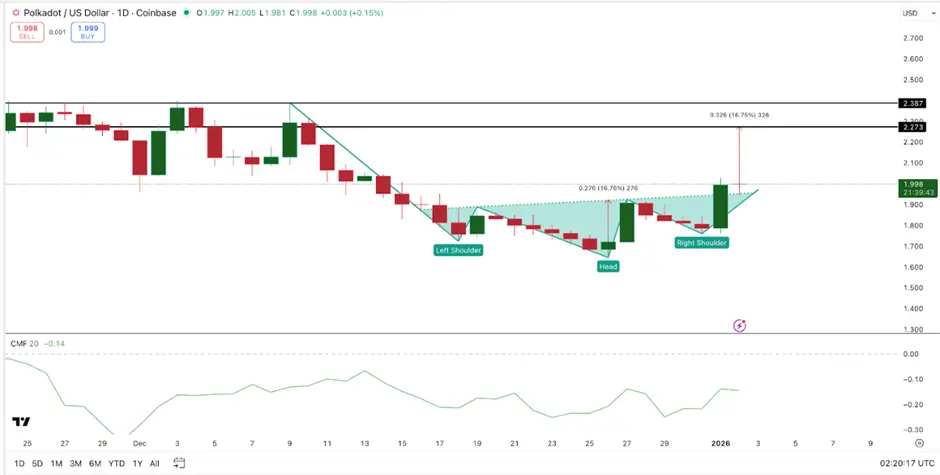 DOT CMF Indicator | Source: TradingView The DOT balance on exchanges has not changed significantly, reflecting that the recent price increase is mainly driven by short-term sentiment rather than strong capital inflows.
In summary, although technical charts show positive signals, the fundamental factors related to capital flow have not yet fully supported a sustained rally.
Important Price Levels of DOT to Watch
In the context of mixed indicators, identifying key price zones becomes more important than peripheral information.
If DOT stays above $2.02, the bullish outlook remains. This is a short-term support zone, maintaining the breakout structure.
Conversely, if DOT drops below $1.76, the technical pattern will weaken, buying pressure may retreat, and market confidence could decline rapidly.
If DOT breaks below $1.64, the recovery is likely to end, and the price could revert to a prolonged downtrend.
Currently, DOT’s movement remains uncertain. The Kusama upgrade provides upward momentum, and technical charts create trading opportunities, but what’s missing is confirmation from trading volume and capital flow. Without improvements in these factors, DOT’s rally may be only temporary.
Disclaimer: The information on this page may come from third parties and does not represent the views or opinions of Gate. The content displayed on this page is for reference only and does not constitute any financial, investment, or legal advice. Gate does not guarantee the accuracy or completeness of the information and shall not be liable for any losses arising from the use of this information. Virtual asset investments carry high risks and are subject to significant price volatility. You may lose all of your invested principal. Please fully understand the relevant risks and make prudent decisions based on your own financial situation and risk tolerance. For details, please refer to
Disclaimer.
Related Articles
BSC Chinese meme coins surge across the board, as CZ’s tweet sparks a “Crypto Summer” craze
On April 13, Chinese meme coins across the BSC chain rose across the board, led by “Binance Life,” with a weekly gain of up to 360% and an intraday increase of over 45%. CZ’s post sparked resonance with “Crypto Summer,” energizing sentiment across the entire sector. Although market sentiment has surged in the short term, the high volatility and liquidity risks of meme coins cannot be ignored, and investors need to be cautious.
MarketWhisper1h ago
Bittensor founder accuses former brother of betrayal; TAO’s sudden plunge sparks 9.1 million liquidations
Bittensor co-founder Jacob Steeves accuses Covenant AI’s Simon Dare of intentionally causing damage to the agreement, leading to a sharp drop in TAO tokens. Steeves proposes a locked-staking mechanism that uses on-chain code to enforce commitments and prevent founders from making sudden, surprise exits. Even as the crisis unfolds, Bittensor’s open-source architecture can still ensure the agreement continues to operate, and it is set to hold a meeting to introduce the new mechanism.
MarketWhisper1h ago
Bloomberg strategist Mike McGlone: a crypto bear market or at the early stage, with Bitcoin potentially falling back to $10k
Bloomberg strategist Mike McGlone says the crypto bear market may be in its early stages, and Bitcoin could fall to $10k. Even though Bitcoin ETFs have matched S&P 500 ETF returns, Bitcoin ETFs have higher volatility and the valuation of underlying assets that lack real support remains elevated.
GateNews2h ago
Why is Bitcoin down today? The U.S. military blocks the Strait of Hormuz, but Iran-U.S. talks end in failure
The U.S. imposes a naval blockade on Iran, causing the U.S.-Iran nuclear talks to fall apart. Market risk sentiment intensifies, and Bitcoin drops to $71,000, with a 24-hour decline of 3.1%. Traditional market capital flows into safe-haven assets, and analysts are divided on Bitcoin’s future trend, with $70,000 support acting as a key level.
MarketWhisper2h ago
The Crypto Fear and Greed Index drops to 12, and the market is in extreme fear
Gate News message, April 13. According to Alternative.me data, today the Crypto Fear and Greed Index is 12, down further from yesterday’s 16, with the market in an “extreme fear” state. This index evaluates market sentiment across multiple dimensions, including volatility, market trading volume, social media, market surveys, Bitcoin’s share of the overall market, and Google Trends keyword analysis. The lower the number, the greater the level of fear.
GateNews3h ago
ETH 15-minute drop of 0.66%: short-term holders selling off in tandem with exchange net inflows amplifies the selling pressure
2026-04-12 22:00 to 22:15 (UTC), ETH showed a clear downward move in a highly liquid environment. The candlestick chart indicates a return of -0.66%, with price fluctuations ranging from 2186.76 to 2211.25 USDT, and a swing amplitude of 1.11%. Market attention rose rapidly, short-term sentiment turned cautious, and volatility intensified.
The main driving factors behind this unusual move are a sharp increase in exchange net inflows and concentrated selling by short-term holders. On-chain data shows that over the past 24 hours, net inflow of ETH into exchanges totaled 9,567.65 ETH, suggesting that a large amount of capital entered the market in the short term, potentially increasing selling pressure.
GateNews5h ago
