
Date: Mon, Dec 29, 2025 | 04:10 PM GMT
The broader cryptocurrency market has seen a short-term pullback over the past few hours, with Bitcoin (BTC) slipping below the $87K level after briefly trading above $90K. This retracement has spilled over into major altcoins, including Avalanche (AVAX), which is also experiencing mild selling pressure.
AVAX is trading slightly in the red today, but beneath the surface, its price structure is beginning to tell a more constructive story. The 4-hour chart reveals a high-probability bullish setup that could hint at a stronger upside move once momentum fully shifts back in favor of buyers.
Source: Coinmarketcap
Power of 3 Pattern Takes Shape
On the 4-hour timeframe, AVAX appears to be forming a classic Power of 3 (PO3) pattern — a structure commonly linked to smart money accumulation and trend continuation. This pattern typically unfolds in three distinct phases: accumulation, manipulation, and expansion, often preceding a sharp directional move.
Accumulation Phase
During the accumulation phase, AVAX spent an extended period trading sideways within a defined range, capped by resistance near $14.80 and supported around $12.64. This tight consolidation reflected balance between buyers and sellers, allowing larger participants to quietly build positions while volatility remained compressed.
The prolonged range-bound action signaled that selling pressure was gradually being absorbed, even as the broader trend remained weak.
Manipulation Flush
The manipulation phase played out when AVAX briefly broke below the $12.64 support, triggering a sharp downside move toward the $11.31 area. This sudden drop resembles a classic liquidity sweep, where stop-loss orders and late sellers are flushed out before a reversal takes place.
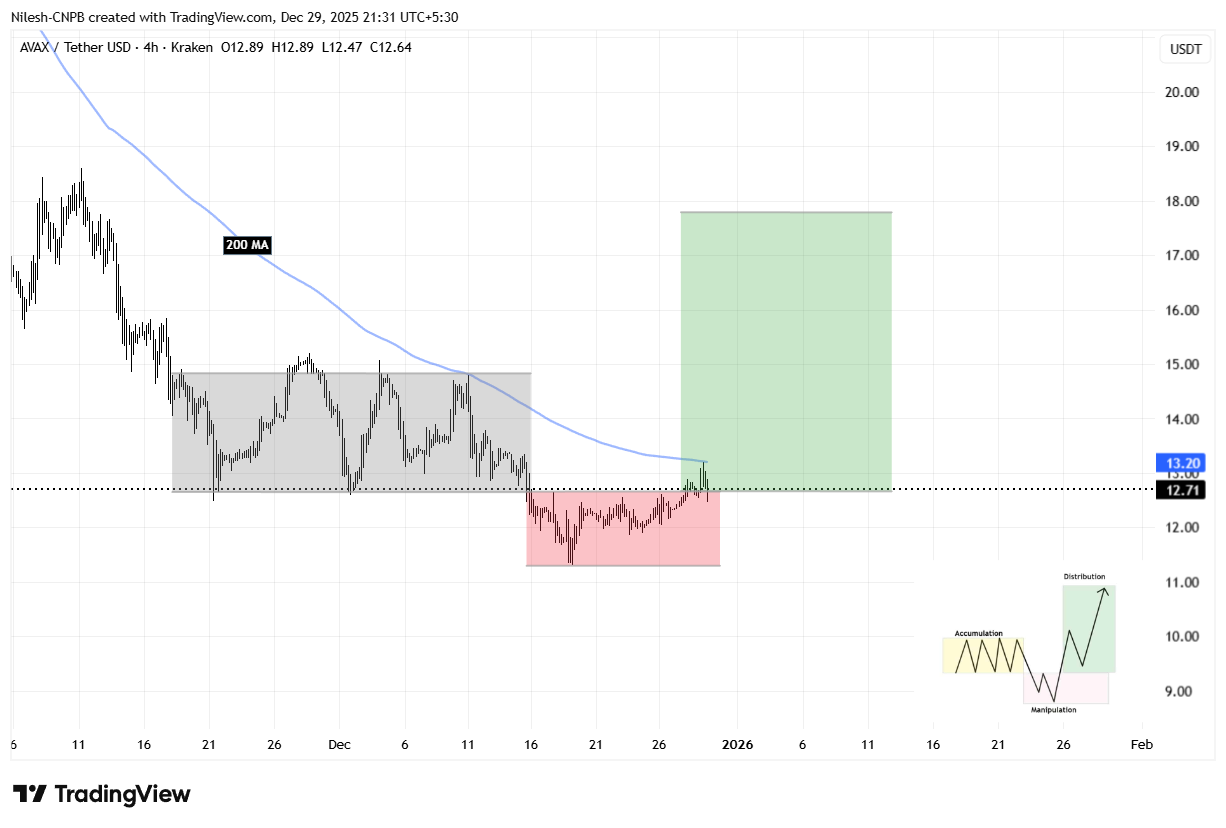
Avalanche (AVAX) 4H Chart/Coinsprobe (Source: Tradingview)
Expansion Phase Begins to Unfold
Following the sweep of lows, AVAX rebounded quickly and reclaimed the $12.64 level, signaling that buyers have stepped back in with conviction. This recovery suggests the early stages of the expansion phase may now be underway.
Price is currently pushing toward the 200-hour moving average near $13.20, a level that has consistently acted as dynamic resistance during the broader downtrend. A sustained move above this moving average would represent a meaningful shift in short-term momentum and strengthen the bullish reversal narrative.
What’s Next for AVAX?
If AVAX manages to break and hold above the 200-hour moving average, the next major resistance lies at $14.80 — the upper boundary of the prior accumulation range. A decisive reclaim of this zone would confirm a bullish breakout and likely attract fresh momentum participation.
Based on the Power of 3 structure, a successful breakout could open the door for a measured move toward the $18.29 region, derived from projecting the height of the accumulation range upward from the breakout point. This target aligns closely with the expansion zone highlighted on the chart.
That said, caution remains necessary. A failure to hold above $12.64 would weaken the expansion thesis and could force AVAX back into consolidation, delaying any meaningful upside continuation.
For now, AVAX sits at a technically critical inflection point. The structure suggests that smart money positioning may already be in progress, with the coming sessions likely to determine whether the expansion phase fully materializes.
Disclaimer: The views and analysis presented in this article are for informational purposes only and reflect the author’s perspective, not financial advice. Technical patterns and indicators discussed are subject to market volatility and may or may not yield the anticipated results. Investors are advised to exercise caution, conduct independent research, and make decisions aligned with their individual risk tolerance.
About Author: Nilesh Hembade is the Founder and Lead Author of Coinsprobe, with over 5 years of experience in the cryptocurrency and blockchain industry. Since launching Coinsprobe in 2023, he has been providing daily, research-driven insights through in-depth market analysis, on-chain data, and technical research.

Disclaimer: The information on this page may come from third parties and does not represent the views or opinions of Gate. The content displayed on this page is for reference only and does not constitute any financial, investment, or legal advice. Gate does not guarantee the accuracy or completeness of the information and shall not be liable for any losses arising from the use of this information. Virtual asset investments carry high risks and are subject to significant price volatility. You may lose all of your invested principal. Please fully understand the relevant risks and make prudent decisions based on your own financial situation and risk tolerance. For details, please refer to
Disclaimer.
Related Articles
PEPE Holds Tight Range as Bearish Pressure Limits Upside
Key Insights:
PEPE trades within a narrow consolidation range as sellers maintain control, while repeated resistance rejections prevent any sustained bullish momentum in the market.
Fibonacci resistance zones continue to cap upside potential, with multiple barriers aligning alongside
CryptoNewsLand33m ago
Shiba Inu Defies Bearish Setup as Short Squeeze Lifts Price
Key Insights
Shiba Inu price surged despite bearish death cross signals as short liquidations intensified, driving a rapid upward move during low liquidity conditions.
A dragonfly doji and tightening Bollinger Bands supported bullish momentum, reinforcing a reversal pattern after sustained d
CryptoNewsLand37m ago
Solana Recovery Gains Pace While Derivatives Data Shows Split Sentiment
Key Insights
Solana records four consecutive days of gains as funding rates rise, signaling stronger retail interest while overall market conviction remains divided across participants.
Declining futures Open interest alongside rising funding rates highlights reduced trader exposure,
CryptoNewsLand1h ago
Solana Eyes $90 as Volume Surge Fuels Short-Term Rally
Key Insights:
The Solana price rebounded from recent lows near $80 as trading volume surged sharply, signaling renewed participation and stronger short-term market momentum.
A golden cross on lower time frames reinforced bullish sentiment, with technical indicators suggesting continued
CryptoNewsLand1h ago
ETH 15-minute drop of 0.69%: Price pressure from declining burn volume and short-term capital arbitrage
2026-04-09 18:00 to 2026-04-09 18:15 (UTC), ETH closed down 0.69% within a 0.88% intraday trading range, with the price fluctuating between 2203.91 and 2223.58 USDT. Trading volume in this range rose slightly, market attention stayed high, but short-term volatility increased, prompting investor caution.
The main drivers behind this unusual move are that ETH on-chain Gas fees have fallen to historical lows, causing the EIP-1559 burn amount to decline. As a result, the net-supply contraction effect weakened, and the supply-demand structure faced adjustment pressure in the short term. Meanwhile,
GateNews1h ago
BTC drops 0.62% over 15 minutes: exchange net inflows intensify and short-term arbitrage converges to trigger volatility
From 18:00 to 18:15 on April 9, 2026 (UTC), the BTC price return recorded -0.62%, closing in the range of 71857.8 to 72375.1 USDT, with a trading range of 0.72%. Market attention was notably elevated, volatility intensified, and capital moved quickly within a short period. Overall market sentiment has become more cautious, and investors’ willingness to trade in the short term has increased.
The main driving force behind this abnormal move is an increase in net inflows to BTC exchanges during the anomaly window; the 10-minute net flow reached 755.92 BTC, indicating that some investors chose to transfer funds to exchanges to seek arbitrage opportunities in the midst of the volatility issue
GateNews1h ago
