Cardano (ADA) enters the early days of the new year with a positive outlook, continuing to maintain a stable upward momentum and trading around the $0.36 mark at the time of writing on Friday. On-chain indicators along with developments in the derivatives market show a clear improvement, reflecting increasing buying pressure and growing investor interest. In this context, technical signals continue to lean towards a positive scenario, with a focus on the potential formation of a breakout trend in the near future.
On-chain and Derivatives Data of Cardano Indicate an Uptrend
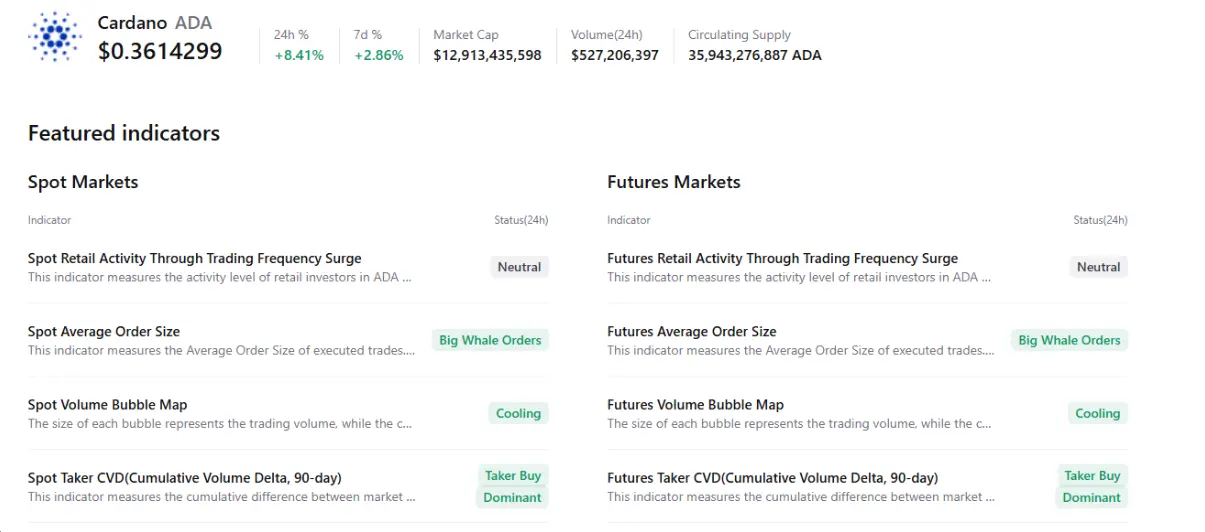
Aggregated data from CryptoQuant paints an optimistic picture for Cardano. Both the spot market and futures contracts show large buy orders from “whales,” amid cooling market conditions and a clear dominance of buying pressure. These signals suggest trader sentiment is significantly improving, raising expectations for a potential bullish breakout in the coming days.
 Source: CryptoQuant Not only that, but Cardano’s funding rate data also reinforce the positive outlook. According to the OI-Weighted Funding Rate index from Coinglass, the number of traders betting on an upward trend currently outweighs those expecting continued weakness in price.
Notably, the funding rate has turned positive since Thursday and reached 0.0068% on Friday, reflecting that the (Long) side is willing to pay fees to the (Short) side. Historically, as shown on the chart, whenever the funding rate shifts from negative to positive, Cardano’s price has often experienced strong upward movements.
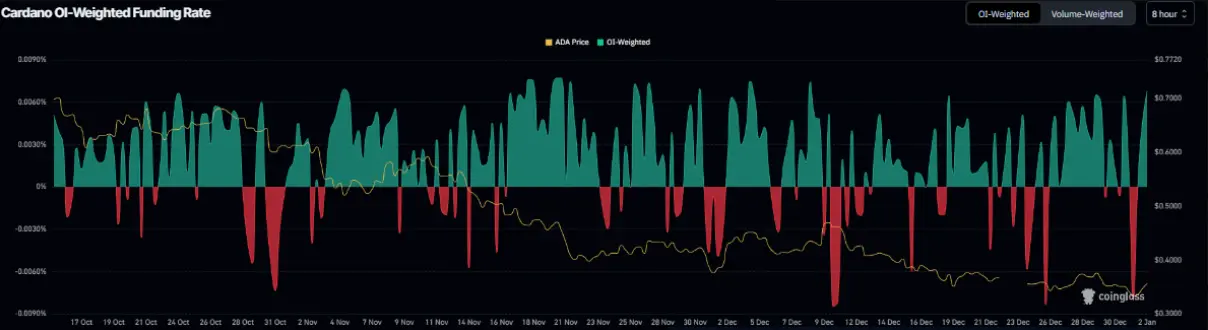 Cardano Funding Rate Chart | Source: Coinglass## Cardano Price Forecast: New Year Brings Optimism as ADA Approaches Breakout of Descending Wedge Pattern
The price of Cardano (ADA) faced strong resistance at the upper trendline of the descending wedge pattern — formed from mid-October by connecting the peaks and troughs with two converging trendlines. After being rejected at this level on Monday, ADA plunged nearly 10% by Wednesday. However, the market quickly saw a significant rebound: the price recovered 6.9% on Thursday and by Friday had approached the critical resistance trendline again.
In a positive scenario, if ADA decisively breaks out of the descending wedge pattern, the recovery momentum is likely to extend toward the nearest resistance zone around $0.42 — coinciding with the 50-day exponential moving average (EMA), which holds notable technical significance.
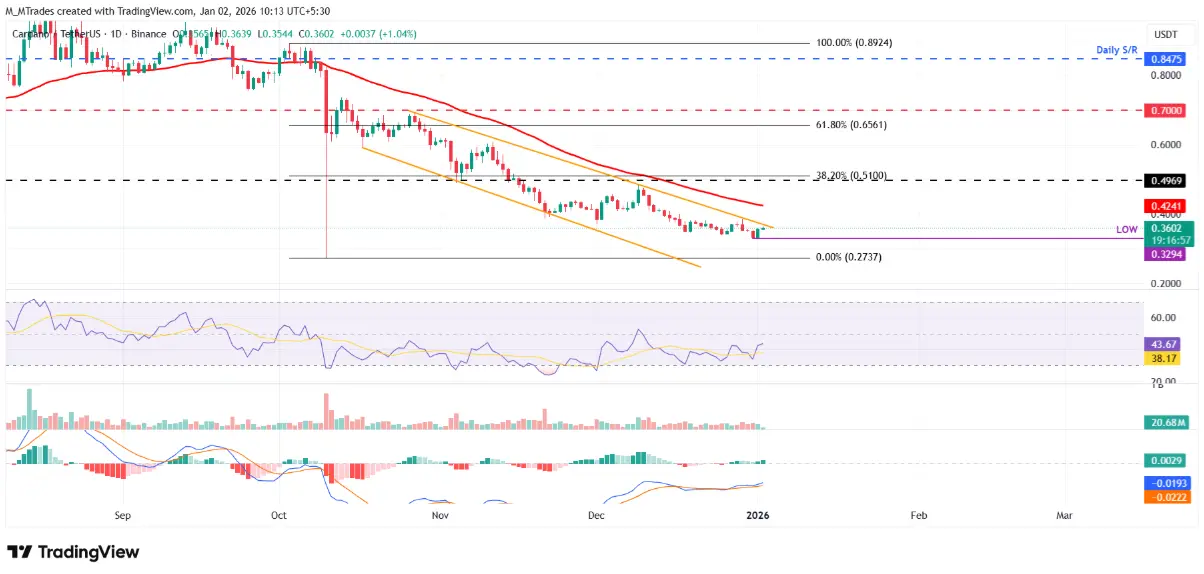 Daily ADA/USDT Chart | Source: TradingView Momentum indicators are also signaling improvement. The RSI on the daily timeframe is currently at 43 and trending upward toward the neutral zone at 50, indicating selling pressure is gradually weakening. For the bullish trend to become more sustainable, RSI needs to break above and hold above 50. Meanwhile, the MACD indicator has formed a bullish crossover and remains maintained, further supporting the view that the market is leaning slightly towards a recovery scenario.
However, the risk of correction still exists. If ADA fails to break out and reverses downward, the price could continue to test the support zone established on Wednesday, around the $0.32 level.
Disclaimer: The information on this page may come from third parties and does not represent the views or opinions of Gate. The content displayed on this page is for reference only and does not constitute any financial, investment, or legal advice. Gate does not guarantee the accuracy or completeness of the information and shall not be liable for any losses arising from the use of this information. Virtual asset investments carry high risks and are subject to significant price volatility. You may lose all of your invested principal. Please fully understand the relevant risks and make prudent decisions based on your own financial situation and risk tolerance. For details, please refer to
Disclaimer.
Related Articles
Crypto consolidates as volatility cools and futures markets tilt bearish
The crypto market continued to exhibit signs of choppiness on Friday, with bitcoin BTC$67,135.03 trading at $67,000 in the middle of a trading range that spans back to early February.
A selection of altcoins picked up during the lower liquidity Asia hours, prompting the likes of ALGO and RENDER to
CoinDesk41m ago
XRP Eyes $1.50 Breakout as Price Holds Critical Range
XRP trades in a tight range, testing support near $1.33 and resistance $1.40–$1.42.
A breakout above $1.50 could signal bullish momentum toward $1.52–$1.60.
Breakdown below $1.27 may extend the current downtrend and increase selling pressure.
Ripple’s XRP continues to trade within a
CryptoNewsLand1h ago
CryptoQuant: Ethereum derivatives market net traders trading volume turns positive, buyer pressure reaches $104 million
On April 4, CryptoQuant analyst Darkfrost posted a message, pointing out that the Ethereum derivatives market is showing a “structural change.” The net trader execution volume has turned positive for the first time, with buy-side pressure in control, which could help form a market bottom and may kick off a new round of upside.
GateNews1h ago
VanEck Research Director: BTC derivative protective demand hits the 99th percentile historically, signaling a potential contrarian long setup
VanEck Research head Matthew Sigel said that demand for hedging in the Bitcoin derivatives market has reached the 99th percentile in history, suggesting that it may be suitable to establish long positions. At the same time, he warned that high capital expenditures in the artificial intelligence sector could put pressure on the market, especially in the S&P 500.
GateNews3h ago
Bitcoin’s ‘no direction’ action may lead to heavier breakout: Analyst
Bitcoin's prolonged consolidation below $70,000 may indicate a potential rally, despite mixed analyst sentiment. While some predict a breakout, others warn of deeper bearish trends. Current trading is stagnant, with Bitcoin at $66,890.
Cointelegraph4h ago
