
Date: Mon, Dec 29, 2025 | 12:25 PM GMT
The broader cryptocurrency market is experiencing a short-term pullback, with Bitcoin (BTC) slipping to $87K level after briefly reclaiming $90K earlier today. This mild retracement has weighed on sentiment across the market, with several altcoins also trading under pressure — including Filecoin (FIL).
FIL is trading in the red today, but beneath the surface, its technical structure is beginning to show signs of recovery. Despite the short-term weakness, the chart is now flashing a harmonic setup that could support a continued upside move if key levels are reclaimed.
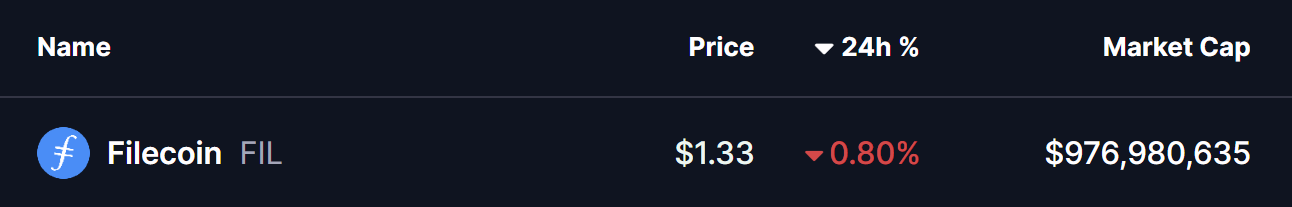
Source: Coinmarketcap
Harmonic Pattern Hints at Potential Upside
On the 4-hour chart, Filecoin appears to be forming a Bearish Bat harmonic pattern — a structure that often allows for a bullish advance during the CD leg before reaching the Potential Reversal Zone (PRZ).
The pattern originated near Point X around $1.595, followed by a sharp decline into Point A. From there, FIL rebounded into Point B before pulling back once more into Point C near the $1.201 region. This area acted as a strong demand zone, where buyers stepped in aggressively to prevent further downside.
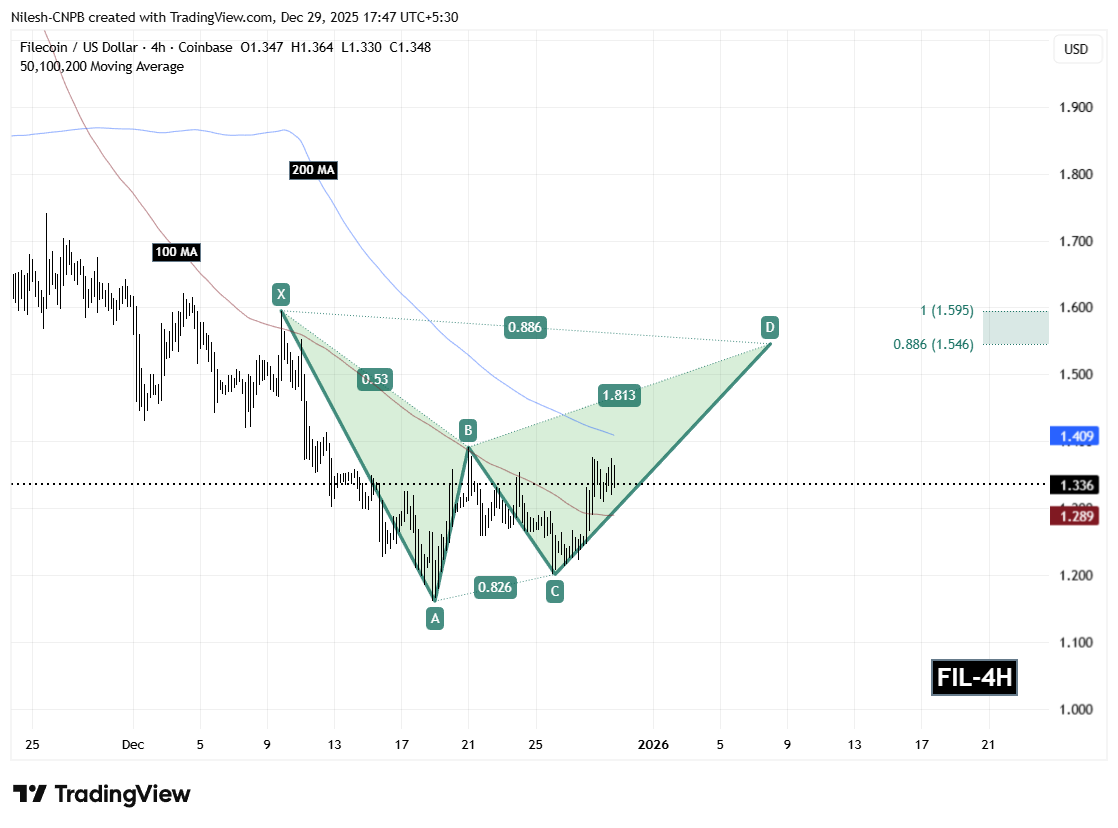
Filecoin (FIL) 4H Chart/Coinsprobe (Source: Tradingview)
Since establishing the Point C low, FIL has staged a steady recovery and is now trading near $1.336. Importantly, price has reclaimed the 100-hour moving average around $1.289 — a key short-term signal that selling pressure is easing and buyers are beginning to regain control.
The next major technical hurdle sits at the 200-hour moving average near $1.409. A clean break and sustained hold above this level would confirm the continuation of the CD leg and significantly strengthen the bullish case.
What’s Next for Filecoin (FIL)?
If FIL continues to defend the 100-hour MA and manages to flip the 200-hour MA into support, the harmonic structure points toward a move into the PRZ zone. Based on Fibonacci projections, this target area lies between $1.546 (0.886 extension) and $1.595 (1.0 extension).
This zone represents the completion of the Bearish Bat pattern and aligns with prior resistance, making it a logical area where price could react or consolidate. Until then, the short-term trend remains constructive as long as FIL continues to print higher lows and maintain its reclaimed moving average support.
On the downside, failure to hold above the 100-hour MA could result in temporary consolidation or a shallow pullback, though the broader recovery structure would remain intact as long as the $1.20 support zoneC remains protected.
Overall, Filecoin is approaching a technically important phase. While broader market volatility persists, the harmonic setup, improving structure, and key moving average reclaim suggest FIL may have room to extend higher in the near term if momentum continues to build.
Disclaimer: The views and analysis presented in this article are for informational purposes only and reflect the author’s perspective, not financial advice. Technical patterns and indicators discussed are subject to market volatility and may or may not yield the anticipated results. Investors are advised to exercise caution, conduct independent research, and make decisions aligned with their individual risk tolerance.
About Author: Nilesh Hembade is the Founder and Lead Author of Coinsprobe, with over 5 years of experience in the cryptocurrency and blockchain industry. Since launching Coinsprobe in 2023, he has been providing daily, research-driven insights through in-depth market analysis, on-chain data, and technical research.

Disclaimer: The information on this page may come from third parties and does not represent the views or opinions of Gate. The content displayed on this page is for reference only and does not constitute any financial, investment, or legal advice. Gate does not guarantee the accuracy or completeness of the information and shall not be liable for any losses arising from the use of this information. Virtual asset investments carry high risks and are subject to significant price volatility. You may lose all of your invested principal. Please fully understand the relevant risks and make prudent decisions based on your own financial situation and risk tolerance. For details, please refer to
Disclaimer.
Related Articles
XRP Today’s News: Institutional funds return, circulating inflow of 120 million exceeds Bitcoin
This week, XRP recorded a $119.6 million capital inflow, setting the highest mark since 2025 and becoming a major beneficiary in the crypto market. This round of funds returning was mainly driven by greater clarity in regulatory policy and XRP’s real-world use in cross-border payment infrastructure. Technically, it shows an initial recovery, but overall it is still in a downward channel. The support and resistance levels are $1.31 and $1.40, respectively; if it breaks through, it is expected to reach $1.50.
MarketWhisper2h ago
XRP drops to $1.33, with $3.32 million in ETF inflows still failing to reverse the downtrend; the key support to watch is $1.28
In April 2026, the XRP price pulled back to $1.33, down about 4%. Although there was capital inflow into Ripple-related products, selling pressure dominated the market, and increased trading volume signaled distribution. Declining liquidity further heightens volatility risk; watch the $1.33 support—if it breaks, prices will likely fall further. For a short-term rebound, it needs to break above $1.35; otherwise, it should remain in a weak range-bound consolidation.
GateNews2h ago
XRP Price Structure Signals More Downside — Key Levels to Watch
XRP fails to make new highs, confirming bearish market structure remains intact.
Price targets $1.13, $1.08, and potentially $0.87 support levels.
Traders should wait for confirmation instead of reacting to short-term price moves.
Short bursts of green candles can quickly shift market
CryptoNewsLand2h ago
Bitcoin is hovering around the $700,000 level; if oil prices fall below $100 or push toward $80,000
Bitcoin has recently been trading in a high-level range. The price rebounded from $67,000 to $70,900, driven by a U.S.-Iran ceasefire agreement. Market analysis suggests that weakness in oil prices—or easing inflation pressure—may support Bitcoin’s upside. If it breaks above $72,500, it could trigger short liquidations and push the price up to $80,000. However, instability in the Middle East and a rebound in oil prices could act as a drag. Volatility in the energy market will be a key factor influencing Bitcoin’s direction.
GateNews2h ago
Tom Lee: The stock market often hits bottom early in a war, bullish on Ethereum and tech stocks
Well-known analyst Tom Lee said in an interview that despite the U.S.-Iran conflict and rising oil prices, the stock market did not fall, showing that the market has strong resilience. He believes that most S&P constituents have undergone significant adjustments, that the worst-case scenario for the overall market may already be behind us, and that there is room for upside from here. He is bullish on Ethereum as well as technology, industrial, and mid- and small-cap stocks.
GateNews3h ago
Michael Saylor: Bitcoin may have already hit bottom, but quantum risks have been exaggerated
Strategy Executive Chairman Michael Saylor believes Bitcoin hit its bottom around $60,000 this February, because all forced sellers in the market have already exited. He said that the catalyst for the next bull market will be a bitcoin-based banking credit system, while he believes the threat from quantum computing is being exaggerated, and he pointed out that the technical community has enough time to deal with this threat.
MarketWhisper6h ago
