Date: Sun, Dec 28, 2025 | 09:40 AM GMT
The broader cryptocurrency market is showing modest strength, with both Bitcoin (BTC) and Ethereum (ETH) trading in the green. This steady performance among major assets has helped stabilize overall sentiment, allowing select memecoins — including SPX6900 (SPX) — to begin showing constructive technical setups.
SPX is trading with a modest intraday gain, but more importantly, its price structure is starting to reflect a classic bullish reversal pattern. After weeks of sustained downside pressure, buyers appear to be stepping back in at key levels, hinting that the worst of the correction may already be behind.
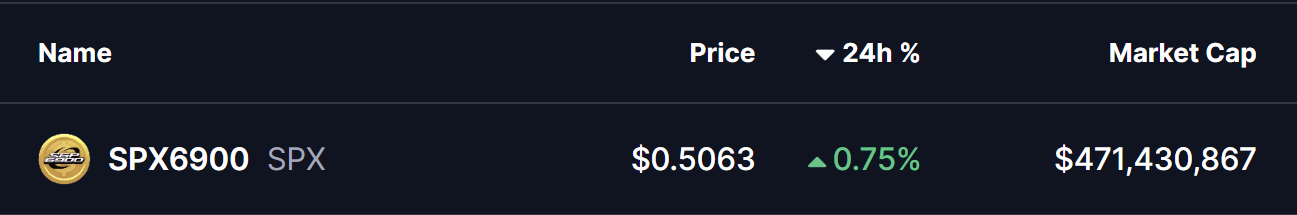
Source: Coinmarketcap
Double Bottom Pattern in Play
On the daily timeframe, SPX is forming a double bottom pattern — a widely followed bullish reversal structure that often appears near the end of prolonged downtrends. The first bottom formed in November when SPX dropped toward the $0.45 region, followed by a recovery that carried price back toward the neckline resistance near $0.7389 in early December.
That recovery attempt, however, was rejected, sending SPX back down to retest the same $0.45 support zone. Importantly, sellers failed to push price meaningfully lower on this second attempt. Instead, SPX printed another strong reaction from the same demand area and has since rebounded to trade around $0.5045.
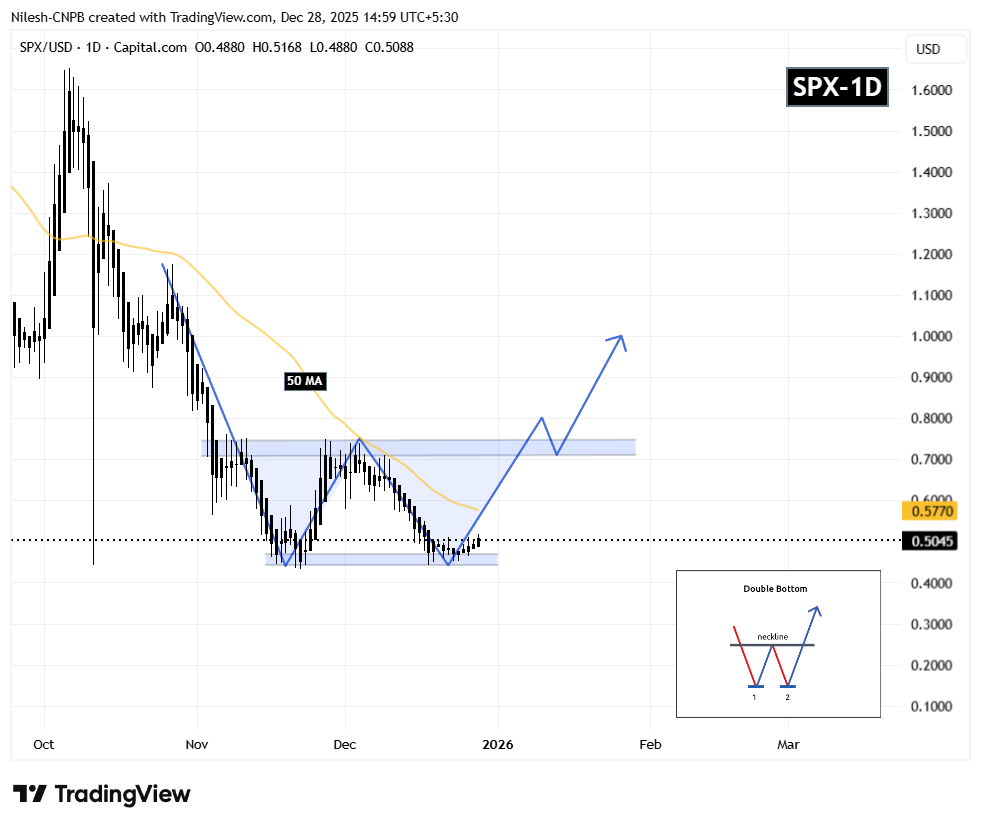
SPX6900 (SPX) Daily Chart/Coinsprobe (Source: Tradingview)
This repeated defense of the same support level is a critical technical signal. It suggests that selling pressure is weakening while buyers are gradually absorbing supply — a behavior typically seen during accumulation phases before trend reversals.
What’s Next for SPX?
For the bullish structure to strengthen, SPX must reclaim the 50-day moving average, currently positioned near $0.5770. A sustained move above this level would mark an important shift in short-term momentum and increase the probability of a continued recovery toward the neckline resistance at $0.7389.
A decisive breakout above the neckline — ideally followed by a successful retest — would confirm the full activation of the double bottom pattern. In that scenario, the technical projection points toward a potential upside target near $1.02, representing a significant expansion from current price levels.
Until then, the $0.45 support zone remains the most important level to watch. As long as SPX continues to hold above this area, the broader bullish setup stays intact and allows room for further upside attempts.
Overall, SPX’s structure appears constructive. The presence of a double bottom, repeated demand at identical lows, and proximity to the 50-day moving average suggest that this could be a pivotal moment as the token attempts to transition from accumulation into a new expansion phase.
Disclaimer: The views and analysis presented in this article are for informational purposes only and reflect the author’s perspective, not financial advice. Technical patterns and indicators discussed are subject to market volatility and may or may not yield the anticipated results. Investors are advised to exercise caution, conduct independent research, and make decisions aligned with their individual risk tolerance.
About Author: Nilesh Hembade is the Founder and Lead Author of Coinsprobe, with over 5 years of experience in the cryptocurrency and blockchain industry. Since launching Coinsprobe in 2023, he has been providing daily, research-driven insights through in-depth market analysis, on-chain data, and technical research.

Disclaimer: The information on this page may come from third parties and does not represent the views or opinions of Gate. The content displayed on this page is for reference only and does not constitute any financial, investment, or legal advice. Gate does not guarantee the accuracy or completeness of the information and shall not be liable for any losses arising from the use of this information. Virtual asset investments carry high risks and are subject to significant price volatility. You may lose all of your invested principal. Please fully understand the relevant risks and make prudent decisions based on your own financial situation and risk tolerance. For details, please refer to
Disclaimer.
Related Articles
ARK 2026 Bitcoin Outlook: ETFs + DAT account for 12% of supply, and an estimated crypto market cap of 28 trillion by 2030
ARK Big Ideas 2026 points out that institutions adopting acceleration and the ETF+DAT merger have already secured BTC 12% of the circulating supply, and governments and state governments are gradually buying in to form long-term support. In 2025, it retraced to the lowest level in history, and volatility declined. By 2030, the market value is expected to be about $28 trillion, BTC about $4.2 trillion, with annual growth of 60–61%. In emerging markets, stablecoins replace some BTC reserve-demand, and long-term investors should focus on structural buy orders and risk management.
ChainNewsAbmedia7m ago
Ethereum Outperforms S&P 500 by 1,696 Basis Points Since U.S.-Iran Conflict, Says Tom Lee
Gate News message, April 27 — Tom Lee, chairman of Bitmine, stated that Ethereum has outperformed the S&P 500 index (U.S. benchmark equity index) by 1,696 basis points since the U.S.-Iran conflict, making it the best-performing single asset globally aside from crude oil. According to Lee, ETH has de
GateNews1h ago
New Altcoins Outperform Older Tokens in 2025, Data Shows Divergence in Exchange Performance
Gate News message, April 27 — In 2025, newly launched altcoins significantly outperformed older tokens, marking a shift in how liquidity is allocated across the crypto market. While older altcoins posted net losses between 18% and 23%, newly listed altcoins in 2025 retained 5% in net gains,
GateNews2h ago
SHIB Exchange Inflows Ease as 43B Tokens Hit Platforms
Shiba Inu recorded a softer inflow trend to exchanges after approximately 43 billion SHIB moved to trading platforms in 24 hours, according to on-chain data. The figure remains positive but shows a slower pace compared with earlier spikes, suggesting that short-term selling pressure may be
CryptoFrontier3h ago
NFT Blue Chips Rally as Prices Climb Despite Thinning Market Activity
With 201 sales and approximately 1,000 ETH in volume over the previous seven days, Pudgy Penguins has seen a floor rise above 5 ETH, a 20% increase from last week.
Data from CryptoSlam shows that worldwide sales of NFTs declined to around $175 million in April from $304 million in
TheNewsCrypto3h ago
Bullish Altseason Indicators Continue to Appear as Expectations for New Altcoin ATHs Rise
Bullish altseason indicators continue to appear.
Expectations for new altcoin ATHs to occur rise.
Which altcoin assets will set a new ATH first?
The crypto market continues to hold steady prices as promising crypto assets show high possibilities for their prices to hit higher bullish ta
CryptoNewsLand5h ago