
Date: Tue, Dec 30, 2025 | 06:35 PM GMT
The broader cryptocurrency market is showing modest strength, with both Bitcoin (BTC) and Ethereum (ETH) trading in the green. This steady performance among major assets has helped stabilize overall market sentiment, creating room for select altcoins — including** eCash (XEC) **— to develop constructive technical setups.
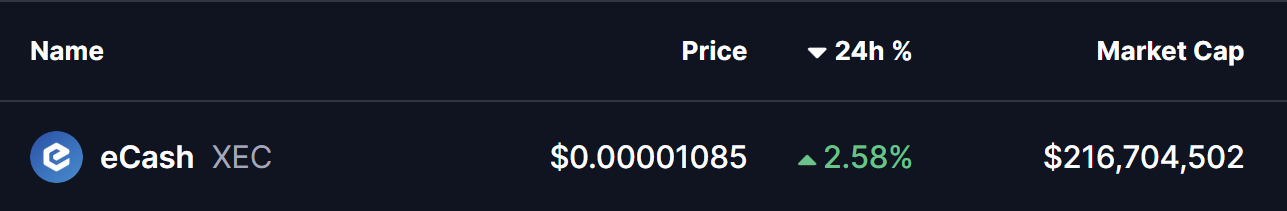
XEC is trading with modest gains, but more importantly, its price structure is beginning to reflect a meaningful shift, as the chart now points toward a potential bullish continuation setup forming beneath key resistance.
Source: Coinmarketcap
Rounding Bottom in Play
On the 4-hour timeframe, eCash is forming a textbook rounding bottom — a classic bullish reversal pattern that typically emerges after prolonged selling pressure. This structure reflects a slow but steady transition from distribution to accumulation, where sellers gradually lose control and buyers begin stepping in with conviction.
Earlier, XEC faced strong rejection near the $0.00001221 neckline zone, which triggered a sharp decline. That sell-off eventually found support near the $0.000010 region, a level that repeatedly acted as a demand zone. Each attempt to push price lower was absorbed, preventing a deeper breakdown and helping establish a rounded base.

eCash (XEC) 4H Chart/Coinsprobe (Source: Tradingview)
Since then, XEC’s price action has started to curve higher in a smooth, controlled manner. The gradual recovery toward the $0.00001221 resistance suggests selling pressure is fading, while accumulation continues to strengthen. This type of rounded structure often precedes a more decisive trend shift once key resistance levels are reclaimed.
What’s Next for XEC?
For the rounding bottom pattern to fully activate, XEC must reclaim the 200-hour moving average, currently hovering near the $0.00001126 region. A decisive break and sustained hold above this level would confirm a momentum shift and signal that buyers are regaining control after an extended corrective phase.
Beyond the moving average, the most critical hurdle remains the neckline resistance around $0.00001221. A clean breakout above this zone would validate the broader reversal structure and could open the door for a bullish expansion toward the $0.00001442 region, which aligns with the projected breakout target from the rounding bottom pattern.
Until these levels are reclaimed, the setup remains in development. Short-term pullbacks or sideways consolidation are still possible if price struggles near the 200-hour MA. However, as long as XEC continues to hold above the rounded base, the broader bottoming structure remains intact.
Overall, eCash is approaching an important technical inflection point. The emerging rounding bottom, improving price structure, and proximity to major resistance levels suggest the coming sessions could play a decisive role in shaping XEC’s next directional move.
Disclaimer: The views and analysis presented in this article are for informational purposes only and reflect the author’s perspective, not financial advice. Technical patterns and indicators discussed are subject to market volatility and may or may not yield the anticipated results. Investors are advised to exercise caution, conduct independent research, and make decisions aligned with their individual risk tolerance.
Disclaimer: The information on this page may come from third parties and does not represent the views or opinions of Gate. The content displayed on this page is for reference only and does not constitute any financial, investment, or legal advice. Gate does not guarantee the accuracy or completeness of the information and shall not be liable for any losses arising from the use of this information. Virtual asset investments carry high risks and are subject to significant price volatility. You may lose all of your invested principal. Please fully understand the relevant risks and make prudent decisions based on your own financial situation and risk tolerance. For details, please refer to
Disclaimer.
Related Articles
Crypto Market Sees Wider Rebound As $ETH and $BTC Lead Gains Despite Fearful Sentiment
The crypto market experienced a 2.23% gain, reaching a $2.36T market cap, with Bitcoin and Ethereum rising 3.17% and 3.78%, respectively. Notable gainers included $TRUMP, $GROK, and $MAGA. DeFi TVL increased by 1.72%, while NFT sales rose 5.79%. HypurrFi warned users of domain hijacking, and Apple removed Bitchat from China.
BlockChainReporter51m ago
Bitcoin rallies on report of Iran ceasefire talks, Algorand extends gains
Bitcoin BTC$69,892.51 climbed to near $70,000 as traders reacted to signs of possible de-escalation in the Iran war and amid a short squeeze that liquidated more than $270 million in shorts.
Crypto prices rose, along with equity index futures and equities, as Axios reported that the U.S. and Iran a
CoinDesk1h ago
Chainlink Sees 25% Whale Growth: Will LINK Push Toward $27?
Chainlink whales grew 25% in a year, signaling strong accumulation by large holders.
Institutional adoption and reserve growth tighten LINK supply, supporting potential upward price movement.
LINK trades in a narrow range; a breakout could push toward $27.
Chainlink — LINK, has been
CryptoNewsLand3h ago
Hyperliquid Faces Volatility as Whales Shift Positions: Will HYPE Hold $35?
Whale activity drives HYPE volatility, creating uncertainty around short-term price movements.
Accumulation trends remain strong, with investors moving $11.7 million HYPE off exchanges.
Key support at $33.48–$35.19 may determine whether HYPE rebounds or drops further.
Hyperliquid — HYPE,
CryptoNewsLand4h ago
BTC profit/loss trade ratio is 2.95, the highest level in 12 weeks
Gate News message: On April 6, according to Santiment data, the BTC profit-loss trade ratio reached 2.95, the highest level in 12 weeks. This indicator measures the ratio of profitable trades to losing trades; the current value shows that the share of profitable trades in the market is significantly higher than that of losing trades, reaching a recent peak level.
GateNews4h ago
