 Zcash has been quietly doing its thing, but the chart is starting to stand out. Since breaking out earlier this month, the ZEC price hasn’t slipped back into its old range or given back much of its gains. Instead, price has stayed elevated and continued to move higher in a pretty direct way.
That kind of price action usually isn’t random. It indicates buyers are still in control and that the move hasn’t run out of steam yet. Rather than showing signs of topping out, ZEC looks like it’s pausing and sizing up its next move.
Zcash has been quietly doing its thing, but the chart is starting to stand out. Since breaking out earlier this month, the ZEC price hasn’t slipped back into its old range or given back much of its gains. Instead, price has stayed elevated and continued to move higher in a pretty direct way.
That kind of price action usually isn’t random. It indicates buyers are still in control and that the move hasn’t run out of steam yet. Rather than showing signs of topping out, ZEC looks like it’s pausing and sizing up its next move.
- Why the $532–$549 Area Is So Important for ZEC
- Liquidity Above Could Act Like a Magnet
- What to Watch Next for ZEC
Why the $532–$549 Area Is So Important for ZEC
The most crucial place to keep eyes on the 4-hour chart would be the $532-$549 range. This level always acted as a distribution area where the sellers hit the market hard. It’s also exactly where price is spending time now, which makes it a natural point of tension.
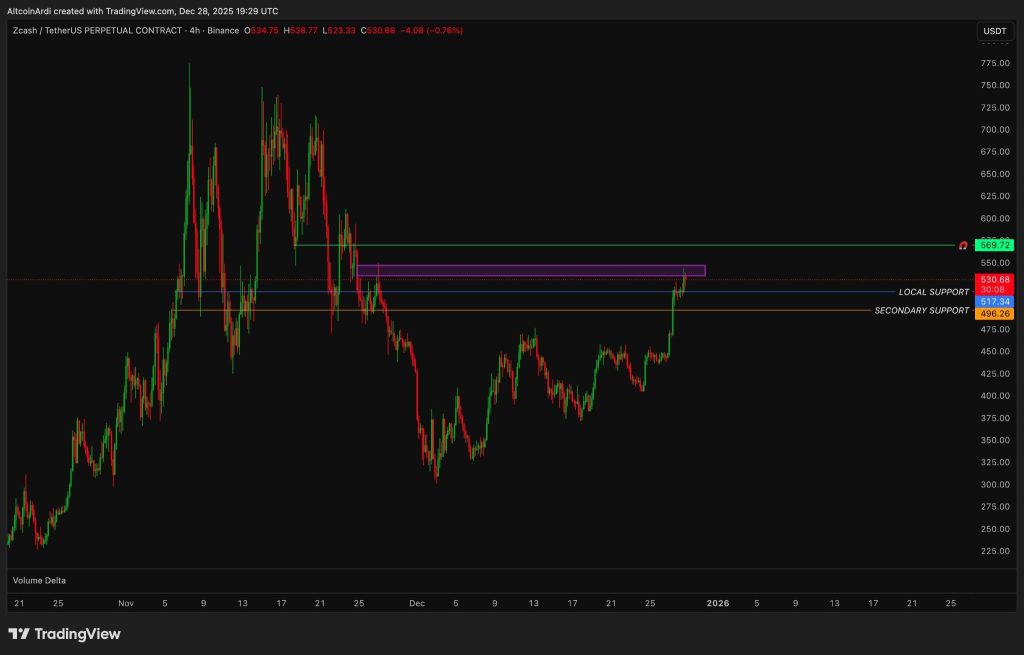
Source: X/@ArdiNSC
As Ardi pointed out, Zcash is still moving almost vertically since its breakout. The key thing here is that the ZEC price hasn’t been rejected hard from this zone yet.
As long as ZEC keeps pressing into it instead of rolling over, the structure still favors continuation rather than a reversal.
A clean move above $549 would matter. It would clear out the last major pocket of supply in this range and shift attention toward higher levels.
Read Also: $ZEC Price Pumps as Zcash Data Shows Privacy Usage Holding Ground Ahead of 2026
Liquidity Above Could Act Like a Magnet
If the ZEC price does manage to push through the $532–$549 region, the chart shows a fairly open path toward the $570–$580 zone. That’s where the next cluster of liquidity sits, and the price often gets drawn toward those areas once nearby resistance is cleared.
That doesn’t mean the move would be perfectly smooth, but once price breaks into thinner territory, follow-through can happen faster than many expect. That’s why this resistance zone is such a big deal right now.
On the downside, ZEC still has room to breathe. The first level to keep an eye on is around $515, which has already acted as local support. Below that, the $490–$500 area stands out as a stronger support zone and a more meaningful line in the sand.
As long as the ZEC price stays above these areas, pullbacks don’t look threatening. They look more like normal pauses within a broader uptrend. The trend only really comes into question if those support levels fail cleanly.
What to Watch Next for ZEC
Right now, ZEC is in a pretty classic continuation setup. It broke out, held its gains, and is now pushing into a key resistance area. Price action in the $532 to $549 range will likely set what happens next.
If there’s a breakout, the focus will shift to the $570-$580 level. Even if there’s a rejection with the possibility of support above the $500 level, the scenario will remain the same.
For now, Zcash isn’t flashing signs of weakness. It’s showing patience. And when the ZEC price stays patient near resistance, it often means the market is getting ready for its next expansion.
Disclaimer: The information on this page may come from third parties and does not represent the views or opinions of Gate. The content displayed on this page is for reference only and does not constitute any financial, investment, or legal advice. Gate does not guarantee the accuracy or completeness of the information and shall not be liable for any losses arising from the use of this information. Virtual asset investments carry high risks and are subject to significant price volatility. You may lose all of your invested principal. Please fully understand the relevant risks and make prudent decisions based on your own financial situation and risk tolerance. For details, please refer to
Disclaimer.
Related Articles
ETH up 0.65% in 15 minutes: amplified net exchange outflows, short-term buy pressure, and on-chain activity plus a surge of new users driving the rebound
During the period from 12:45 to 13:00 (UTC) on 2026-04-17, the ETH price recorded a +0.65% return, closing in the 2355.76 - 2382.28 USDT range, with a 15-minute amplitude of 1.13%. During this time, market attention rose rapidly, on-chain and derivatives trading activity increased significantly, and short-term volatility intensified.
The main driving force behind this unusual move is that the net exchange fund inflow-outflow phenomenon has been amplified. On-chain data show that within 10 minutes, approximately $420,000 worth of ETH was continuously transferred out of trading platforms, reflecting a significantly stronger investor willingness to hold tokens,
GateNews36m ago
Altcoin XRP Forms Elliott Wave on the Weekly Price Chart, Potential Bullish Divergence Ahead?
Altcoin XRP forms Elliott Wave on the weekly price chart.
A potential bullish divergence lies ahead for XRP price.
Can Ripple’s XRP go on to set a new ATH this year?
Several altcoins continue to show promising price pump indicators across their various price charts, allowing analysts t
CryptoNewsLand1h ago
BTC drops 0.52% in 15 minutes: Whale inflows to exchanges combined with insufficient liquidity amplify sell pressure
From 2026-04-17 10:15 to 2026-04-17 10:30 (UTC), the BTC price rapidly fell within the 75214.3 – 75725.9 USDT range. The cumulative return over 15 minutes was -0.52%, and the amplitude reached 0.68%. During this period, market sentiment shifted from cautious to bearish, volatility on the board increased, mainstream trading pairs saw an increase in主动 sell-side volume, buy-side acceptance became constrained, and overall trading activity declined significantly.
The primary driver behind this unusual move is that large holders (whales) concentrated their short-term inflows into exchanges. On-chain data shows that net inflows to addresses holding more than 1000 BTC per address changed from a steady state to a positive value, directly boosting exchange balances over the short term. Historical data indicates that whale inflows to exchanges are highly correlated with sell pressure in the medium to short term. In the same period, order book snapshots reflected a significant increase in the volume of主动 sell orders, and the成交价梯度 shifted downward, highlighting that weak market absorption capacity caused a short-term drop in price.
In addition, in the derivatives market, the long/short positioning structure tilted toward shorts. The number of主动 sell contracts exceeded that of buys in a short time, and rising pressure to close long positions further intensified the downtrend. Market liquidity overall was relatively weak; the number of active addresses over the past 10 minutes was only about 42k, and both fees and the mempool were near their lowest levels of the recent month. Against a backdrop of insufficient capital absorption, the marginal impact of large sell orders was amplified. On the macro front, the Federal Reserve’s monetary policy tightening and industry media repeatedly downgraded BTC’s near-term expectations led investors’ risk appetite to generally decline, creating a resonance at the level of market sentiment.
In the short term, it is still necessary to stay alert to liquidity risk and the price impact of one-way large transactions in specific trading pairs. Going forward, focus on key developments such as changes in whales’ on-chain holdings, exchange balances, and rebounds in activity metrics, as well as the potential impact of macro policy direction on risk assets. Relevant users should primarily guard against the risk of sharply amplified short-term price volatility and promptly track more market information.
GateNews3h ago
Popular Analyst Remains Aggressively Bullish on Crypto Prices, Predicts Parabolic Surges Soon
Popular analyst remains aggressively bullish on crypto prices.
The expert then predicts parabolic surges soon.
The move could spark dead coins into pumping heavily as well.
The crypto community continues to hold
CryptoNewsLand3h ago
RAVE, SIREN Rally Despite Manipulation Warnings
Rave DAO and Siren tokens surged to near all-time highs, facing volatility and liquidation risks. Concerns grew over potential market manipulation and supply concentration, particularly for RAVE. A new KuCoin listing boosted RAVE's visibility, despite inherent trading risks.
CryptoFrontier3h ago
ETH rises 0.65% in 15 minutes: ETF fund inflows and leverage long accumulation resonate to lift spot prices
Between 2026-04-17 09:15 and 2026-04-17 09:30 (UTC), ETH fluctuated within the 2351.53 to 2376.99 USDT range. The 15-minute return recorded +0.65%, with a swing of 1.08%. Within this range, buying pressure significantly strengthened, with trades dominated by medium-sized orders, which increased market attention and amplified short-term volatility.
The main drivers behind this anomaly are continued inflows of institutional capital into ETH spot ETFs, especially with cumulative net inflows over the past 4 days exceeding $212 million. On April 17 alone, the ETF added an additional $9.5 million in inflows, and spot buy orders expanded in sync within 15 minutes. Leveraged long positions in the derivatives market are the second-largest catalyst. From April 14 to 17, ETH futures open interest grew 26% week over week, indicating that capital via multiple paths is simultaneously betting on an upside move. The funding rate being neutral suggests the leveraged structure is temporarily healthy.
In addition, global macro market risk appetite has rebounded (geopolitical tensions easing, and the Federal Reserve keeping rates unchanged), driving a broad rebound across mainstream risk assets, and the crypto market has attracted liquidity accordingly. At the industry level, major financial institutions are advancing filings for ETFs and trust products. Mining companies have increased their ETH holdings and also maintained active staking activity, further reinforcing medium- to long-term market expectations. Multiple factors overlap and resonate, amplifying volatility. On-chain transfers remain generally stable, and there is no abnormal concentration of fund flows migrating between exchanges.
What needs attention is that although the current market is lifted by the resonance of institutional capital and leverage, the continuous growth of futures positions combined with the spot price failing to rise above the 2400 USDT area will bring the risk of forced liquidation. Meanwhile, if ETF subscription inflows slow down or macro liquidity reverses, ETH spot support could weaken. Please focus on tracking ETF net inflows, changes in futures open interest, the macro news backdrop, and nearby support and resistance levels, and stay alert to short-term volatility and potential abrupt adjustments. For more real-time market information, please keep watching.
GateNews4h ago
