Date: Sun, Dec 28, 2025 | 09:40 AM GMT
The broader cryptocurrency market is showing modest strength, with both Bitcoin (BTC) and Ethereum (ETH) trading in the green. This steady performance among major assets has helped stabilize overall sentiment, allowing select memecoins — including SPX6900 (SPX) — to begin showing constructive technical setups.
SPX is trading with a modest intraday gain, but more importantly, its price structure is starting to reflect a classic bullish reversal pattern. After weeks of sustained downside pressure, buyers appear to be stepping back in at key levels, hinting that the worst of the correction may already be behind.
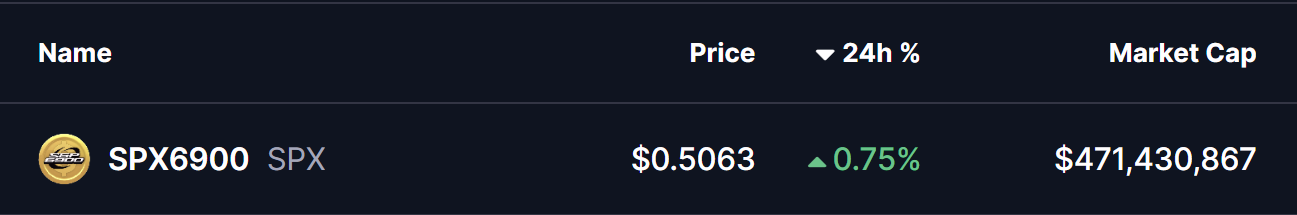
Source: Coinmarketcap
Double Bottom Pattern in Play
On the daily timeframe, SPX is forming a double bottom pattern — a widely followed bullish reversal structure that often appears near the end of prolonged downtrends. The first bottom formed in November when SPX dropped toward the $0.45 region, followed by a recovery that carried price back toward the neckline resistance near $0.7389 in early December.
That recovery attempt, however, was rejected, sending SPX back down to retest the same $0.45 support zone. Importantly, sellers failed to push price meaningfully lower on this second attempt. Instead, SPX printed another strong reaction from the same demand area and has since rebounded to trade around $0.5045.
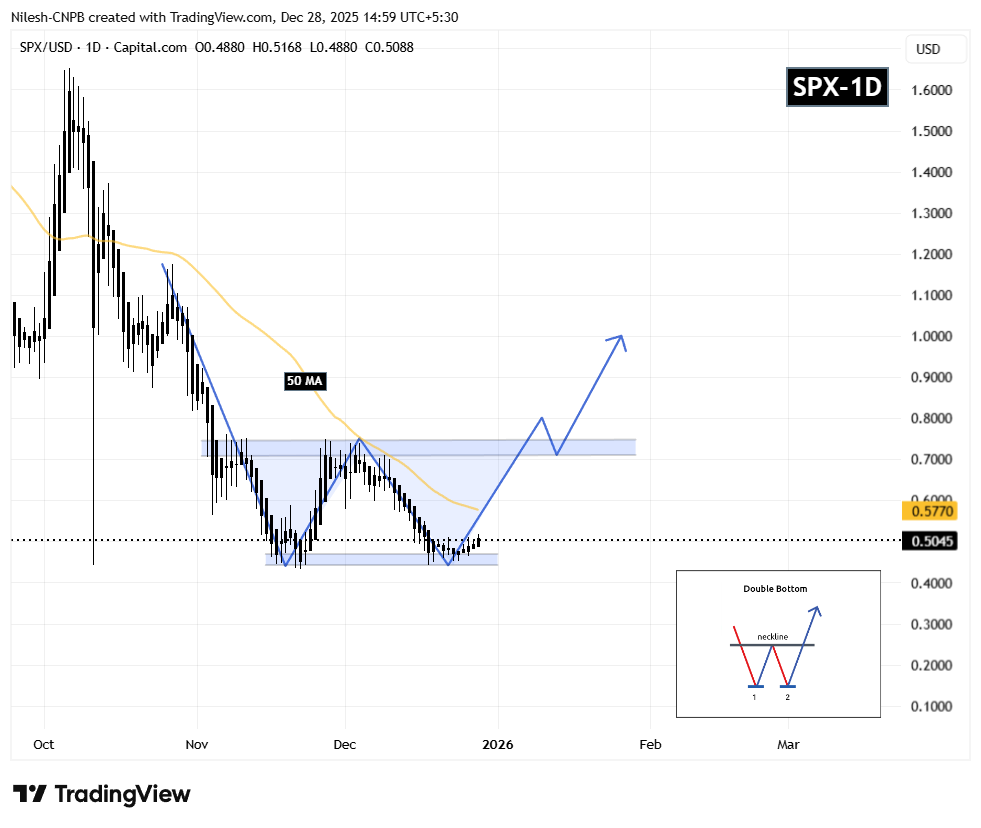
SPX6900 (SPX) Daily Chart/Coinsprobe (Source: Tradingview)
This repeated defense of the same support level is a critical technical signal. It suggests that selling pressure is weakening while buyers are gradually absorbing supply — a behavior typically seen during accumulation phases before trend reversals.
What’s Next for SPX?
For the bullish structure to strengthen, SPX must reclaim the 50-day moving average, currently positioned near $0.5770. A sustained move above this level would mark an important shift in short-term momentum and increase the probability of a continued recovery toward the neckline resistance at $0.7389.
A decisive breakout above the neckline — ideally followed by a successful retest — would confirm the full activation of the double bottom pattern. In that scenario, the technical projection points toward a potential upside target near $1.02, representing a significant expansion from current price levels.
Until then, the $0.45 support zone remains the most important level to watch. As long as SPX continues to hold above this area, the broader bullish setup stays intact and allows room for further upside attempts.
Overall, SPX’s structure appears constructive. The presence of a double bottom, repeated demand at identical lows, and proximity to the 50-day moving average suggest that this could be a pivotal moment as the token attempts to transition from accumulation into a new expansion phase.
Disclaimer
Disclaimer: The views and analysis presented in this article are for informational purposes only and reflect the author’s perspective, not financial advice. Technical patterns and indicators discussed are subject to market volatility and may or may not yield the anticipated results. Investors are advised to exercise caution, conduct independent research, and make decisions aligned with their individual risk tolerance.
About Author
Nilesh Hembade is the Founder and Lead Author of Coinsprobe, with over 5 years of experience in the cryptocurrency and blockchain industry. Since launching Coinsprobe in 2023, he has been providing daily, research-driven insights through in-depth market analysis, on-chain data, and technical research.

Disclaimer: The information on this page may come from third parties and does not represent the views or opinions of Gate. The content displayed on this page is for reference only and does not constitute any financial, investment, or legal advice. Gate does not guarantee the accuracy or completeness of the information and shall not be liable for any losses arising from the use of this information. Virtual asset investments carry high risks and are subject to significant price volatility. You may lose all of your invested principal. Please fully understand the relevant risks and make prudent decisions based on your own financial situation and risk tolerance. For details, please refer to
Disclaimer.
Related Articles
Bitmine promoted to the NYSE main board! Tom Lee: U.S. stocks may be near a bottom, and selling pressure on Ether may ease
Bitmine has officially moved from the NYSE American board to the main board in the United States, marking a major milestone for the company. Despite a sharp drop in the stock price, it has still increased the share repurchase program to $4 billion. The company holds a large amount of Ethereum, and expects that a rebound in the crypto market will help improve its assets and stock price performance.
CryptoCity54m ago
Crypto Market Records Dip While Sentiment Remains Neutral
The global crypto market is undergoing a correction, with a 0.86% drop in total capitalization to $2.41T. Bitcoin and Ethereum fell by 1.21% and 1.33%, respectively. Despite declines in DeFi TVL and NFT sales, some altcoins surged significantly.
BlockChainReporter2h ago
William Blair: After a certain CEX callback, risk is released, and prospects are boosted by USDC growth
Investment bank William Blair said that after a decline in its stock price in the first quarter, a certain CEX has already completed risk clearing, and the market has fully priced in expectations of weak trading volume and revenue. Although the trading data is soft, the impact is limited; the exchange has strengthened its competitiveness through a diversified layout. The stablecoin USDC continues to grow, raising its market share and generating synergistic benefits. Institutional investors are bullish on a market recovery and believe the exchange has upside potential.
GateNews2h ago
BTC 15-minute rise 0.48%: stronger spot buy-side demand combined with shrinking liquidity driving the move
2026-04-13 14:30 to 2026-04-13 14:45 (UTC), BTC saw a +0.48% return within a 0.55% amplitude range (71600.7–71997.0 USDT). During this period, market volatility increased; both spot and on-chain data indicate that short-term capital flows were notably active, market attention rose, and sentiment remains cautious.
The main driver behind this deviation is stronger spot-market buy pressure and the continued net outflow of exchange funds. Specifically, over the past 24 hours, BTC spot trading volume was about $33.15B, compared with the 7-day average
GateNews3h ago
Bitmine gets promoted to the NYSE main board! Tom Lee: US stocks may be at their bottom, and selling pressure on Ether could ease
Bitmine has officially transferred from the NYSE American board to the main board in the United States, marking an important milestone for the company. Despite a significant drop in its share price, it has still increased the share repurchase plan amount to $4.0 billion. The company holds a large amount of Ether, and it expects that a rebound in the crypto market will help improve its assets and share price performance.
CryptoCity3h ago
Gold and silver fall across the board, and the BTC/ETH volatility index rises slightly
On April 13, gold and silver prices fell to $4,732.92 per ounce and $74.209 per ounce, respectively. The BTC volatility index rose by 0.42%, and the ETH volatility index rose by 0.31%. The U.S. dollar versus the Chinese yuan and the Japanese yen edged up slightly, major European stock indexes generally fell, while WTI and Brent crude oil prices rose. The Gate platform supports trading for multiple asset types.
GateNews4h ago
