
Date: Tue, Dec 23, 2025 | 10:20 AM GMT
The broader cryptocurrency market continues to struggle with uneven and choppy price action, a phase that began following the sharp sell-off on October 10. That correction dragged Ethereum (ETH) lower by nearly 20% over the past 60 days, keeping risk appetite subdued across the altcoin space. Pump.fun (PUMP) has not been spared from this weakness, remaining firmly under selling pressure as market sentiment stays cautious.
PUMP is now down more than 57% over the past two months, and while volatility has eased slightly in recent sessions, the daily chart reveals a technical structure that strongly favors further downside rather than an immediate recovery.
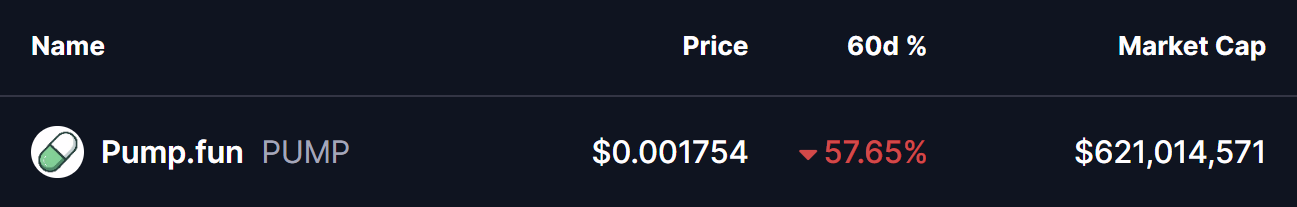
Source: Coinmarketcap
Head and Shoulders Breakdown Confirms Bearish Shift
On the daily timeframe, PUMP formed a textbook head and shoulders pattern — one of the most widely followed bearish reversal formations in technical analysis. The structure began to take shape in late August, with the left shoulder forming near the $0.004 area, followed by a sharp rally that pushed price to a higher peak, creating the head near $0.0095.
The right shoulder developed in early November, topping out around $0.00548 before momentum clearly faded. This failure to reclaim previous highs signaled growing weakness among buyers and set the stage for a breakdown.
As selling pressure increased, PUMP slid toward the neckline support near the $0.0035 zone — a level that had previously acted as a strong demand area. The chart shows that this support ultimately gave way, confirming the head and shoulders breakdown. Once price lost the neckline, downside momentum accelerated, driving PUMP toward the $0.00175 region.
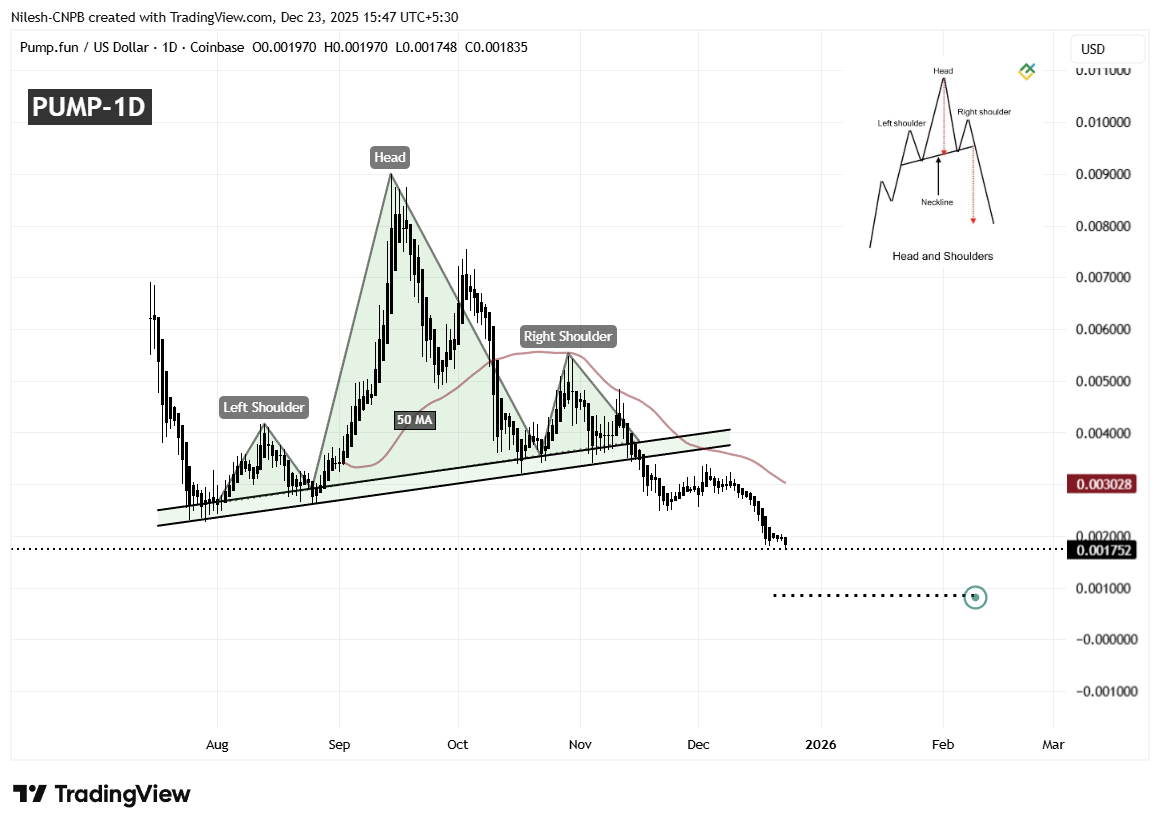
PUMP Daily Chart/Coinsprobe (Source: Tradingview)
This move represents a clear shift in market structure, with sellers firmly in control and bullish momentum largely exhausted.
What’s Next for PUMP?
With the breakdown now confirmed, attention turns to how PUMP behaves around former support levels. The $0.0035 neckline zone has flipped into resistance, and any relief bounce into this area that fails to reclaim it would likely reinforce the bearish outlook.
If downside pressure persists, the measured move from the head and shoulders pattern points toward a potential target near $0.00085. This level aligns with the projected breakdown objective and could act as a temporary pause point if selling accelerates further.
On the upside, a short-term relief rally cannot be ruled out, particularly if broader market conditions stabilize. A reclaim of the 50-day moving average near $0.003028 could trigger a bounce. However, even in that scenario, the overall structure would remain bearish unless PUMP can establish sustained acceptance above this level.
Until then, the trend favors caution, with sellers maintaining the upper hand and downside risks remaining elevated.
**Disclaimer: **The views and analysis presented in this article are for informational purposes only and reflect the author’s perspective, not financial advice. Technical patterns and indicators discussed are subject to market volatility and may or may not yield the anticipated results. Investors are advised to exercise caution, conduct independent research, and make decisions aligned with their individual risk tolerance.
Disclaimer: The information on this page may come from third parties and does not represent the views or opinions of Gate. The content displayed on this page is for reference only and does not constitute any financial, investment, or legal advice. Gate does not guarantee the accuracy or completeness of the information and shall not be liable for any losses arising from the use of this information. Virtual asset investments carry high risks and are subject to significant price volatility. You may lose all of your invested principal. Please fully understand the relevant risks and make prudent decisions based on your own financial situation and risk tolerance. For details, please refer to
Disclaimer.
Related Articles
TAO (Bittensor) down 16.28% over the past 24 hours
Gate News message, on April 10, according to Gate market data, as of the time of publication, TAO (Bittensor) is trading at $269.80, down 16.28% over the past 24 hours. It reached a high of $341.10 and fell to a low of $248.60. The 24-hour trading volume is $14.71 million. The current market cap is approximately $2.59B.
Bittensor is an open-source protocol that supports a decentralized, blockchain-based machine learning network. Machine learning models train collaboratively and earn rewards in TAO based on the value of the information they provide to the collective. TAO also enables external access, allowing users to extract information from the network and adjust network activity according to their own needs.
---
Key recent news about TAO:
1️⃣ **
GateNews24m ago
The Strait of Hormuz is open! Iran demands tolls be paid in Bitcoin, and the Persian Gulf still has “big ships”
The Iranian government charges oil tankers a $1 per-barrel toll for passage through the Strait of Hormuz and requires payment in bitcoin to bypass U.S. sanctions. This move has caused extreme volatility in the cryptocurrency market, with bitcoin’s price surging, highlighting the importance of digital assets in geopolitics. Global shipping has been disrupted, Iran and the United States have taken differing positions in ceasefire talks, and financial markets have also roiled in response to this event.
CryptoCity25m ago
Bitcoin sees over 27k options contracts expire! Analyst: Bear market characteristics continue to dominate
According to Greeks.live data, April 10 saw BTC and ETH options expire. For BTC options, the number of contracts was 27,000, the Put/Call Ratio was 0.71, and the maximum pain point was $69,000. For ETH, it was 151,000 contracts, and the Put/Call Ratio was 0.77. The analysis indicates that market characteristics are skewed bearish, and falling implied volatility suggests the market expects less short-term volatility. Despite the recent rebound, internal momentum in the market has not formed, and no clear sentiment shift has been observed.
MarketWhisper33m ago
Fed Minutes Keep Bitcoin Traders Guessing as Iran Risk Clouds the Next Four Weeks
The Federal Reserve's recent minutes revealed mixed signals on potential rate changes, influenced by inflation and geopolitical tensions. Bitcoin's price is currently around $71,000, with analysts divided on its future amid these macroeconomic pressures, relying on factors like the Iran ceasefire and inflation trends.
CryptoNewsFlash2h ago
Liquid Capital founder Yihua Yi: Long-term bullish but must respect market cycles; currently focusing on AI transformation
Liquid Capital founder Yi Lihua analyzed the reasons the market is under pressure during an AMA, emphasizing that the long-term outlook remains bullish on ETH, but that the market cycle and volatility must be respected. He pointed out the importance of AI technology for business transformation and shared his successful experience investing in companies after they adopted AI for transformation.
GateNews2h ago
Compass Point cuts Circle to Sell, CRCL shares fall more than 10%
Circle Internet Group(CRCL)stock price fell 9.9%, and Compass Point cut its rating to “Sell,” with a target price of $77, reflecting regulatory risk and the impact of market sentiment. At the same time, a hacking incident involving Drift Protocol triggered a collective lawsuit investigation, indirectly affecting CRCL’s stock price. Market awareness of DeFi risks has increased, and with stablecoin legislation stalled, Circle faces greater structural pressure.
MarketWhisper3h ago
